
 Best Platforms
 Live Odds








11 South Carolina Primary Results Mistakes That Mislead Traders
A practical troubleshooter for diagnosing South Carolina primary results headlines before you trade on them—rebuild the decision timeline, separate projections from totals, interpret percentages correctly, verify the right contest, and adjust for county-by-county reporting bias.
If you’ve ever watched “results” swing hard in the first hour of a primary, you’ve seen how easy it is to trade the headline instead of the reality. Early calls, partial precincts, and confusing percentage bars can all point your read in the wrong direction.
This troubleshooter gives you a repeatable way to confirm what actually broke in your process, then neutralize five common South Carolina primary-results mistakes. You’ll know what to verify, which signals to discount, and how to sanity-check what a feed is really showing before you act.
Confirm What Broke
South Carolina primary results only matter if they changed a specific trade you placed or skipped. Pin down the exact decision, then trace which headline or feed pushed you over the line.
Define the decision
Write down the trade as you actually executed it, not the story you told afterward. Specify the instrument, the timeframe you traded, and what you expected the result to do to price.
Example: “Bought S&P 500 futures for an overnight hold, expecting a clean call to reduce uncertainty and lift risk.” The goal is one falsifiable expectation tied to one action.
Capture your inputs
Collect what you relied on in the moment, before you clean it up. You want artifacts, not memory.
- Links to headlines and liveblogs you read
- Screenshots of calls and vote shares
- Timestamps with timezone noted
- Push alerts, emails, and app notifications
- Your order tickets or broker fills
If you can’t produce the artifact, treat it as hearsay.
Rebuild the timeline
Order the key moments so you can see where the narrative diverged from the data.
- Record the first headline you saw and its timestamp.
- Note the first AP-style “call” you relied on, if any.
- Log any official updates you checked during the window.
- Mark your entry, any adjustments, and your exit times.
- Add revisions, walk-backs, or later clarifications you noticed.
Once it’s sequenced, the weak link usually jumps off the page.
Set the ground truth
Pick an authoritative baseline, then label everything else as provisional. For South Carolina, that baseline is the South Carolina election office releases and the certified results when available.
Treat media calls, platform tickers, and “unofficial results” widgets as useful signals, not facts. Your review should clearly mark what was official, what was a projection, and what was just a fast-moving tally.
Mistake 1: Early Calls
Projection banners are designed to be decisive, not cautious. Traders read certainty into graphics, then position before the count earns it.
The trap gets worse when networks shift from “too close” to “projected” in a single chyron change. That micro-moment can front-run your risk controls.
Spot projection language
Election labels look similar on screen, but they signal different confidence. Treat them like different instruments with different liquidity.
- Projected winner: outlet has called it
- Leading: current margin, not a call
- Reporting: percent of precincts, not votes
- Too close: no call, even if leading
- Recount range: margin may tighten
Trade the label, not the vibe.
Trading fix
Use a wait rule so the banner can’t bully you.
- Require two independent calls before entering.
- Or require a vote-in threshold you predefine.
- If sources disagree, reduce size or stand down.
- Only scale after the next update confirms direction.
Rules beat adrenaline.
Fast verification
Verify the call with sources that behave differently under pressure.
- Check AP and Reuters for matching calls
- Open the official state results page
- Compare margin and vote-in context
- Watch for “updated at” timestamps
If it’s real, it shows up everywhere.
When to ignore noise
Early calls are most fragile when the remaining vote is lopsided. That happens with late-reporting metros, absentee batches, and provisional-heavy counties.
Also watch for slow rural precinct uploads that create a fake “red wave” early. The first half of returns can be a different electorate than the last half.
Your edge is knowing when the count hasn’t met the headline yet.
Mistake 2: Unofficial Totals
Unofficial precinct reports are fast, messy snapshots, not the final vote record. Traders treat them like settled facts, then get chopped when late-counted ballots and reporting lags flip the shape of the race.
Unofficial vs certified
Unofficial results are what election night systems publish from precincts as they report, plus any centrally counted batches that happen to be processed early. They often exclude or undercount ballots still in queues, like provisionals awaiting eligibility checks, mail ballots still being verified, and duplicates needing adjudication.
Certification happens after counties reconcile ballots, resolve challenges, and produce a final canvass that the state accepts. Trade the tape if you want, but label it correctly: you’re trading a partial dataset.
Coverage gaps
Early totals can look complete while key inputs are still missing or delayed.
- Late precinct uploads after closeout
- Provisional ballots pending verification
- Cured ballots added after fixes
- Reporting lags from busy counties
If your feed can’t tell you what’s missing, assume it’s material.
Trading fix
You need a sizing rule that respects uncertainty, even when the headline screams.
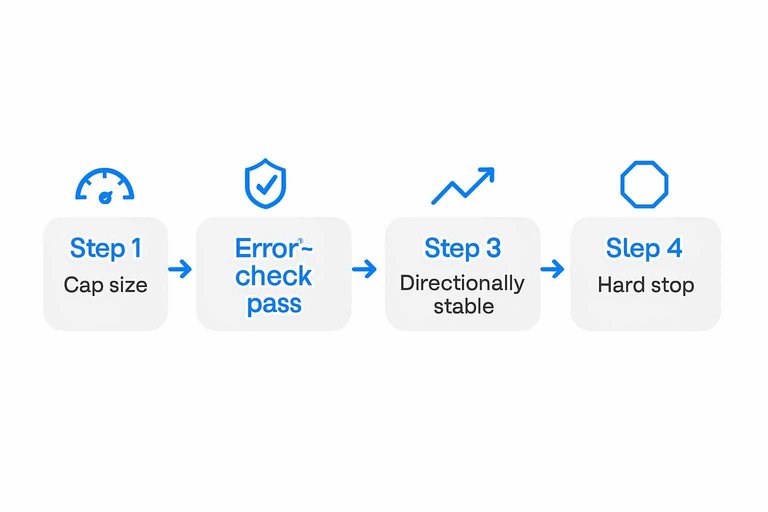
- Cap size until your feed shows a defined precinct-reporting threshold.
- Require an error-check pass: no negative deltas or precinct-count rollbacks.
- Increase size only after two consecutive updates are directionally stable.
- Keep a hard stop if a “batch dump” county is still outstanding.
Your edge isn’t speed alone; it’s knowing when speed is lying.
Sanity checks
Incomplete counts leave fingerprints if you compare them against themselves. Watch turnout consistency across similar precincts and look for completion patterns that make no geographic sense, like small rural precincts “finished” while large urban ones stall.
When the internal shape is off, treat the move as a positioning squeeze, not new information.
Mistake 3: Percent Reporting
Percent reporting looks like progress, but it often mixes different denominators.
Precincts-in, estimated vote-in, and “feed completeness” can all show up as the same % label.
What % can mean
The same “65% reporting” label can describe three different things.
And they drift apart when late precincts are large, estimates get revised, or feeds arrive out of order.
Precincts-in (% of precincts reporting): counts units, not ballots.
Estimated vote-in (% of expected votes counted): models remaining turnout, then updates the model.
Feed completeness (% of data ingested): tracks pipeline status, not election progress.
Treat % as a definition check, not a trading signal.
Red flags to watch
Percent looks clean until the update mechanics get messy.
Watch for these clues that the denominator changed.
- % stalls while vote totals rise
- % jumps backward after an update
- Totals change with no % change
- Different sites show different %
- % moves but margins freeze
If you see two red flags, your “%” is not a stable yardstick.
Trading fix
Switch your trigger from “% reporting” to margin behavior across consistent updates.
- Track margin and total votes each update.
- Confirm the denominator stays consistent within the same source.
- Require margin stability across at least three updates.
- Only act when stability holds through a timestamped refresh.
- Pause if a revision note or backfill appears.
Trade the slope of the margin, not the marketing number.
Cross-source reconcile
When two sites disagree, assume they’re measuring different denominators.
Favor the source that defines its % math and shows update timestamps.
If a site won’t say what “% reporting” means, it’s not a reference feed.
Mistake 4: Wrong Election Type
South Carolina primaries look familiar, so traders often map the wrong rulebook onto the tape. That error can flip your read on turnout, momentum, and “surprises” before you even get to markets.
Identify the contest
You need the contest metadata before you interpret any chart, crawl, or headline. Without it, you’ll treat rules-driven outcomes as signal.
Check these items before you react:
- Party primary: which party, which ballot
- Open vs closed: who can participate
- Allocation method: winner-take-all, proportional, thresholds
- Unit of reporting: statewide, district, precinct
Get the rule set right first, then decide if the move is real.
Common mix-ups
Most mistakes are basic category errors, not bad math. They spread fast because the numbers still look “official.”
- Mixing party primaries into one “state result”
- Confusing statewide totals with district-level outcomes
- Treating delegates as votes, or votes as delegates
- Assuming general-election turnout logic applies
- Reading early-reporting patterns as final structure
If you see inconsistent “leads,” you’re often looking at mismatched units.
Trading fix
Use a checklist that forces you to name the election type and the number you’re trading. Fast beats smart when your inputs are correct.
- Label the contest: party primary, not “South Carolina election.”
- Verify openness: open, closed, or hybrid participation.
- Confirm the unit: votes, delegates, or districts shown.
- Identify the driver: which metric your thesis depends on.
- Re-check sources: official feed versus secondary aggregators.
Trade the variable you actually modeled, not the one trending on screens.

Implication mapping
Map one election variable to one market channel, then keep everything else as narrative risk. For example, if your thesis is “policy risk reprices,” decide whether you need statewide vote share, delegate math, or geographic strength.
Different variables hit different exposures: perceived nominee certainty can affect risk appetite, rate expectations can shift on fiscal assumptions, and sectors can move on regulatory narratives. Keep causality modest, and treat the primary as information about probabilities, not policy outcomes.
When you separate probability updates from storytelling, your positioning gets calmer and cleaner.
Mistake 5: County Bias
Early-reporting counties can move the first margin hard, even when the final map won’t. Traders see “momentum,” chase it, and end up paying for reporting order.
Imagine three small, same-region counties post first, all friendly to one candidate. The tape looks decisive. Then high-turnout, opposite-lean counties land and the margin snaps back.
Understand reporting order
Counties report early for boring reasons: simpler ballots, faster tabulation, fewer precincts, or smoother scanners. Those operational differences often line up with geography, and geography often lines up with vote preference.
A coastal or metro county may take longer because it has more ballots, more precincts, and more edge cases to reconcile. A smaller inland county may post quickly, and if that region leans to one candidate, the early statewide margin will lean too.
Treat early totals like a sample with a built-in filter. That filter is location.
Detect geographic skew
Early totals can be “real” but still untradeable when the map is lopsided. Watch for these tells:
- Same-region counties posting first
- Urban centers missing from totals
- Rural belt dominating early votes
- High-turnout counties still at zero
- One media market overrepresented
If the first wave shares a map shape, you’re not seeing sentiment. You’re seeing logistics.
Trading fix
You can’t remove county bias. You can price it in.
- Build expected turnout by county from recent primaries.
- Convert each update into “% of expected vote reported.”
- Track margin versus weighted reporting, not raw counties.
- Delay directional trades until both urban and rural blocs appear.
- Scale in only after the next distinct region confirms.
Your edge comes from normalization, not speed.
Stability threshold
You need a rule that stops you from trading the first clean-looking number. Use a stability gate tied to geographic diversity, not just more votes.
Act only after the margin holds through additions from at least three distinct regions, with at least one high-turnout county included. If the margin survives those different “county types,” it’s closer to signal.
If it can’t survive a map change, it won’t survive the night.
Mistake 6: Assuming “the South Carolina primary results” mean the same thing on every platform
The same South Carolina primary results headline can push prices in opposite directions across platforms—not because “the market is wrong,” but because the market may not be asking the same question. Traders get misled when they treat cross-platform odds as interchangeable and then chase what looks like an arbitrage or a late-breaking “edge.”
Cross-platform mismatch risk usually shows up in three places:
- Market wording: One contract might be about winning the primary, another about winning the most votes, winning a party’s primary, winning statewide, or including/excluding certain vote types. If you skim the headline and ignore the fine print, you may be trading a different outcome than the one the news is describing.
- Liquidity and price impact: A small print headline can move a thin market dramatically while barely budging a deeper one. The move feels like “information,” but it can be just order-book mechanics (wide spreads, few resting orders, and aggressive market orders).
- Settlement rules and sources: Platforms can define how an outcome is resolved (and which official source resolves it) in ways that matter under messy conditions—recounts, corrections, or timing differences between preliminary and certified results. If you don’t know what your contract settles on, you can be right about the election and still be wrong about the trade.
A practical rule: when a results update hits, first verify that the contract you’re trading matches the claim you’re reacting to (winner vs. vote share vs. party vs. timing). Only then compare prices across platforms. Otherwise, you’re comparing apples to oranges—and “cheap” can just mean “different.”
How to spot a mismatch before you trade
Use a quick checklist whenever you compare cross-platform odds:
- Read the full resolution criteria (not just the title): what exact event triggers YES/NO?
- Check the timeframe: does it settle on election night calls, official certification, or something else?
- Confirm the scope: statewide result vs. party primary vs. a specific metric like “most votes.”
- Look at the order book/spread: a large spread or low displayed depth is a warning that price moves may be liquidity-driven.
- Treat “headline parity” as unproven: two markets can reference “South Carolina primary results” and still be defining the outcome differently.
How to use cross-platform comparisons without getting trapped
Cross-platform aggregation is most useful when you treat it as a starting point for verification, not a final answer.
- If one platform moves first, don’t assume it’s smarter—check whether it’s thinner or simply worded differently.
- If prices diverge, map the contracts side-by-side (wording + settlement) before you interpret the gap as mispricing.
- When you do take a position, size for settlement uncertainty: contracts tied to definitions, timing, or source rules can carry risk even when the political outcome feels obvious.
Run a 60-Second Results Sanity Check Before You Trade
- Rebuild the timeline: what you saw, when you acted, and which source/label (projection, unofficial, certified) triggered the decision.
- Verify the contest: confirm the election type, party, and race so you’re not mapping the wrong result to your thesis.
- Normalize the numbers: translate percentages into what they actually represent (vote share vs reporting share) and cross-check totals across at least two sources.
- Adjust for reporting bias: note which counties are in, which are missing, and pause until the remaining geography can’t plausibly flip the read.
Frequently Asked Questions
- Where can I verify primary results South Carolina without relying on TV projections?
- Use the South Carolina Election Commission website for official reporting and cross-check with a major wire service (AP or Reuters) for standardized race calls and updates.
- What’s the difference between AP race calls and certified South Carolina primary results?
- AP calls are statistical projections used by media and markets to declare a winner, while certified results are the legally finalized totals published after canvass and any corrections.
- How do I tell if South Carolina primary results are final on election night?
- Look for explicit labels like “unofficial,” “partial,” or “preliminary,” and confirm whether the state has posted a completion/update timestamp plus a path to certification.
- Do South Carolina primary results matter for national markets if the outcome isn’t close?
- Often they matter through narrative and expectations—momentum, turnout signals, and delegate math—so price moves can happen even when the margin looks decisive.
- What should traders watch besides the headline margin in primary results South Carolina?
- Track turnout versus prior comparable primaries, vote share by key counties/regions, and whether the remaining unreported vote is concentrated in demographically different areas.