
 Best Platforms
 Live Odds








9 Next US President Market Metrics Worth Knowing in 2026
A case-study guide to reading 2026 “next US president” prediction markets like a market analyst—not a headline chaser—covering quality checks, implied probability, spreads and depth, volatility and time-to-resolution, cross-market divergence, discovery speed, concentration, and platform risk.
A single headline odds move can look like “the race just changed,” when it’s often just thin liquidity, a temporary news shock, or one trader pushing price around.
This case study shows you which market metrics actually help you interpret next–US president prices in 2026. You’ll learn how to sanity-check market quality, read odds as implied probability (with caveats), and use spreads, depth, volatility, and cross-market divergence to separate signal from noise—then apply an interpretation playbook to a real timeline without overclaiming what markets can’t know.
Why these metrics
You’re deciding whether prediction markets are a usable input for 2026 presidential outlooks, or just high-engagement entertainment. A “viable signal” is tradable information you can interpret, stress-test, and compare across time. If you can’t separate information from noise, you’re watching a scoreboard, not a model.
Who should care
Different readers need different market checks, because “useful” depends on your decision and your risk.
- Investors: hedge regulatory and macro scenario exposure
- Journalists: avoid amplifying noisy price moves
- Campaign staff: detect shifts before polling catches up
- Bettors: judge edge, limits, and execution risk
If your decision changes with the price, you need metrics that explain the price.
What markets can do
Prediction markets can compress scattered beliefs into one number, updated fast. Traders have incentives to act on new information, and to punish obvious errors.
They complement polls and fundamentals when you treat the price as a probability-shaped consensus, not a prophecy.
Common failure modes
Markets mislead when the “price” reflects microstructure quirks more than beliefs.
- Thin liquidity exaggerates small trades
- Coordinated trading manufactures momentum
- Rule changes reprice contracts overnight
- Settlement ambiguity invites legalistic games
- Poll headlines get reflexively mirrored
When you can’t explain the move, assume structure before story.
Viability criteria
A market is viable when you can trade it cleanly, read it consistently, and audit how it got there. You also need robustness to manipulation, transparent rules, and a clear stance on legal and ethical constraints.
If any one dimension fails, treat the market like commentary, not measurement.
Market quality checks
Before you read a headline price, check whether the market can actually carry information. In 2026, “the market” is often a patchwork of venues, wrappers, and mirror listings—so confident-looking odds can come from thin liquidity, inconsistent contract specs, or fee mechanics rather than broad consensus.
Liquidity depth
Liquidity tells you whether the price is a consensus or a coincidence. Depth, spread, and slippage show how many real opinions sit behind the quote—and whether you can actually trade near it.
Start with the book around the mid-price. Look for stacked size on both sides across multiple ticks, not a single “wall” that disappears when touched. Then compare the bid–ask spread to typical intraday moves; if the spread is a meaningful fraction of the move you care about, the displayed price is more of a negotiation than an estimate.
Next, sanity-check slippage with small hypothetical orders. If a modest trade walks several levels, your chart is being written by market impact. Also watch the gap between “last trade” and “mid”: in thin markets, the last print can be stale or one-sided while the true tradable level is very different.
If a small order can rewrite the chart, you’re reading trades, not beliefs.
Volume context
Volume can signal attention, or it can signal mechanics. In fragmented 2026 markets, headline volume is easy to misread because it can reflect churn, hedging loops, or cross-venue arbitrage rather than new information.
- Prefer sustained flow over one-off spikes
- Check whether volume is paired with tight spreads and stable depth (high volume with fragile depth is a red flag)
- Look for concentration: a few bursts at identical sizes or repetitive timing can indicate one actor recycling risk
- Treat “volume” vs “open interest” (or any outstanding-position proxy the venue provides) as separate: lots of prints with little persistence can be mostly turnover
- Watch for venue warnings or anomalies that suggest self-trading or wash-like patterns
If volume only appears during drama—or appears without durable depth—the price is often a mood ring with fees.
Market continuity
Continuity problems distort interpretation because they break the feedback loop. When trading stops, price stops learning—and in cross-platform ecosystems, “continuous” can still mean “desynced.”
Overnight gaps can be normal, but they also hide how the market processed news. Halts are worse: they can freeze the last print while information keeps moving elsewhere. In addition, venues sometimes pause deposits/withdrawals, limit order types, or degrade matching during incidents; any of those can make prices stickier than they look.
Also watch for continuity breaks created by fragmentation: two venues may list similar-sounding contracts with different settlement sources or candidate definitions, and the quotes can diverge for structural reasons (not because one side “knows” something). Contract migrations, tick-size changes, and re-listed markets can create a “new” chart that isn’t directly comparable to the old one.
Keep the platform status page and incident log bookmarked, because microstructure is often the real headline.
Settlement clarity
Settlement rules decide what the market is actually predicting. Vague language turns winning trades into arguments—and small wording differences across platforms can make “the same” election market meaningfully different.
- Confirm the exact event being settled (nomination vs general election vs inauguration/assumption of office)
- Verify candidate eligibility, substitutions, and how withdrawals/deaths are handled
- Check how contingencies are treated (party replacement, contested conventions, faithless-elector scenarios, or congressional selection mechanisms if relevant to the contract)
- Read how recounts, litigation, and delayed certifications affect timing and whether settlement can be postponed
- Identify the authoritative resolution source and whether it’s a single source or a hierarchy
If you can’t explain settlement in one breath, don’t treat the price as truth.
Nine key metrics
You’ll see the same election contracts quoted everywhere, but the useful work is interpreting them as a system. Track a small set of metrics across platforms, then compare changes and context. Avoid single-point readings and made-up “normal” benchmarks.
1) Implied probability
A contract price can be read as an implied probability, but only under the market’s rules and payout terms. It’s meaningful when pricing is tight, trading is active, and the contract definition is unambiguous.
Implied probability is not a forecast on its own.
Without uncertainty bands and market-health checks, you’re just reading a number, not a signal.
2) Spread and slippage
You’re not tracking “price,” you’re tracking the price you can actually get. Tradability shows up first in the spread and what happens when you try to trade size.
- Record bid-ask spread at several times daily
- Estimate slippage for your typical order size
- Watch spread widening around scheduled news windows
- Note post-news recovery speed in spreads
If you can’t enter and exit cleanly, your probability read is theater.
3) Depth at levels
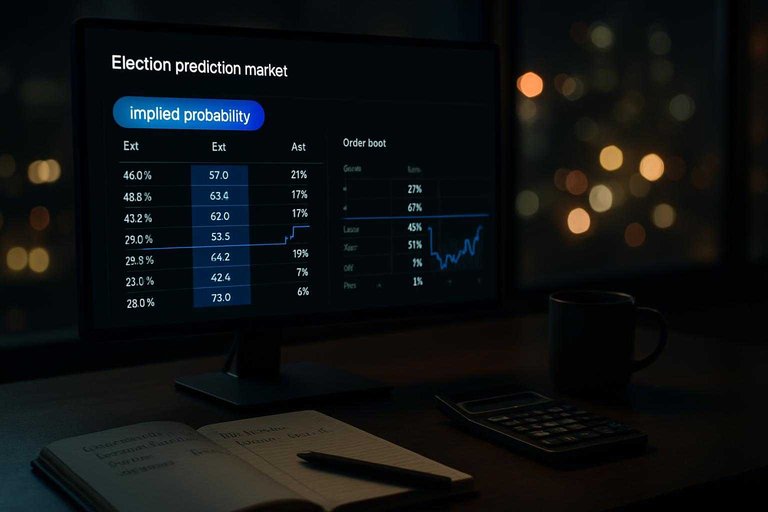
Depth tells you whether the displayed price is supported by real liquidity. Look at shares available near the midprice, then a few ticks away.
Thin depth near the mid and empty books beyond it often mean fragile conviction.
When depth is layered across levels, moves usually need real information, not just a push.
4) Realized volatility
Volatility tells you how “expensive” it is to be early, and how noisy the tape is. Use simple, repeatable calculations that you can compare across venues.
- Compute rolling volatility over a fixed window
- Track intraday high-low range versus open
- Count jump moves beyond a set threshold
- Compare volatility during news and quiet periods
Higher volatility can mean fresh information, or a market that’s easy to yank around.
5) Time-to-resolution
The closer you get to resolution, the more sensitive prices become to concrete, near-term facts. Far from resolution, narratives mean-revert, and “being wrong” costs you longer.
Long time-to-resolution amplifies opportunity cost and margin for noise.
If you trade early, you’re trading path risk, not just the final outcome.
6) Cross-market divergence
Different contracts imply different stories about the same race. Comparing them exposes hidden assumptions and weak links.
- Compare nominee odds versus general-election odds
- Compare presidency with party-control markets
- Compare national contracts with state-level contracts
- Watch divergences that persist after major news
Big inconsistencies are either uncertainty you can’t price yet, or mispricing you can.
Last three metrics
These last three metrics turn market noise into usable signals for a 2026 outlook. They also tell you when the signal is fragile, and when it is surprisingly resilient.
7) Price discovery speed
Price discovery speed is how fast the market reprices after major public news. You track it because fast markets behave like real-time aggregators, while slow markets behave like delayed polls.
Watch the clock around scheduled events: a poll release, a debate start, a surprise headline. Compare (a) the first sharp move, (b) the time to stabilize, and © whether price keeps drifting afterward.
If the move happens during the debate window, the market is digesting live narratives, not just headlines.
8) Trader concentration
Trader concentration shows whether the price reflects many small views or a few big hands. You track it because concentrated flow can fake “consensus” with one shove.
- Repeated whale prints at identical sizes
- Large orders near key levels
- Sudden liquidity disappearance on one side
- Top-holder share, if disclosed
- Recurring “defend and fade” patterns
If two of these cluster, treat price moves as positioning, not belief.
9) Platform risk
Platform risk is everything that can break the link between price and truth. You track it because counterparty, regulatory, and operational shifts can change who is allowed to trade, and how.
Look for abrupt rule changes, market suspensions, contract wording edits, or KYC tightening that blocks a cohort. Each one can force exits, reduce participation, or trap capital, even when “sentiment” is unchanged.
When the rules move, treat the price jump as a data-quality shock first, and an opinion change second.
Interpretation playbook
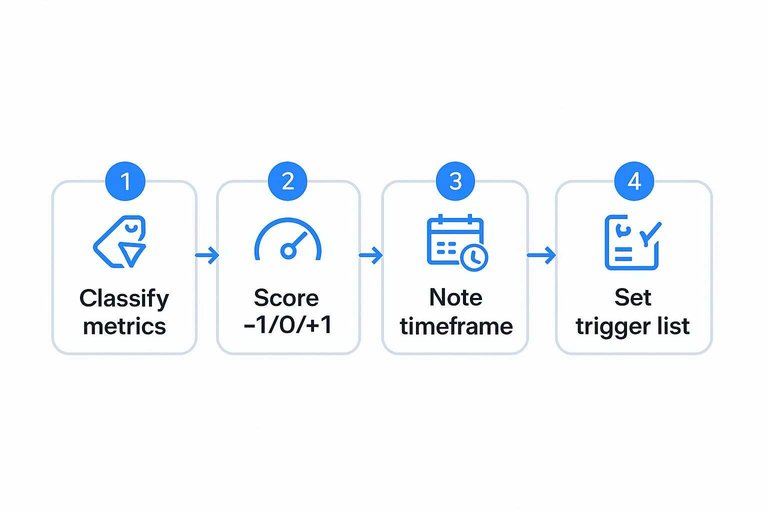
Use this playbook to turn nine market metrics into a single directional read. It keeps you honest when signals conflict and avoids fake precision.
- Classify each metric as risk-on, risk-off, or neutral.
- Score each metric -1, 0, or +1 based on recent direction.
- Note the timeframe each metric reflects: days, weeks, or months.
- Write one sentence explaining the most likely narrative behind the stack.
- Set a trigger list that would flip your read next week.
Treat the score as a dashboard light, not a probability. When three triggers hit, update fast. For context on when markets tend to improve as the horizon shortens, see Forecasting Elections (Journal of Forecasting, 2016).
Real-world example
Imagine a news week where your feed is noisy, but your positions need clean signals. You track the same core market metrics through each shock, then compare what changed and what didn’t. The goal is diagnosis, not drama. For a step-by-step approach to turning those signals into an actual hedge, see how to hedge election risk.
Subsections: [
{
“subheading”: “Event timeline”,
“content”: “You learn fastest when you log before-and-after snapshots around specific timestamps. Capture both "price" and "tradability" so you can separate opinion from execution reality.\n\n| Time (ET) | Event | Capture before | Capture after |\n|—|—|—|—|\n| Mon 9:00 | Debate night preview | Prob, depth, spread | Prob, vol, divergence |\n| Tue 22:30 | Debate ends | Best bids/asks | 1h range, spread |\n| Wed 8:15 | Indictment headline | Depth at top | Gap, spread, halt risk |\n| Thu 14:00 | Health rumor | Cross-market divergence | Reversion, vol spike |\n| Fri 17:00 | Polling drop | Term structure | Close, liquidity |\n\nThe timestamp is your anchor when hindsight tries to rewrite the tape.”,
“description”: “Lay out 3–5 events and timestamps; show what data you capture before/after each event.”
},
{
“subheading”: “Metric-by-metric read”,
“content”: “Price alone tells you sentiment. The other metrics tell you whether that sentiment is tradable, stable, and consistent across venues.\n\nAfter the debate, probability may jump, but check depth and spreads first. If the spread widens and top-of-book size shrinks, the move is fragile.\n\nAfter the indictment headline, probability can gap quickly while volatility spikes. If depth disappears and spreads stay wide, you’re seeing repricing plus fear.\n\nDuring the health rumor, watch divergence across platforms or related contracts. If one venue moves hard while others lag, suspect liquidity or rule differences.\n\nAfter the polling drop, probability might drift lower, but term structure matters. If long-dated contracts barely move, the market doubts persistence.\n\nTreat probability moves as the headline, then use microstructure to decide whether the headline is real.”,
“description”: “Explain how to interpret probability moves alongside depth, spreads, volatility, and divergence after each event.”
},
{
“subheading”: “Lessons learned”,
“content”: “You don’t need perfect forecasts. You need repeatable filters that keep you out of bad fills and bad narratives.\n\n- Avoid thin books during headline windows\n- Confirm settlement terms before sizing up\n- Watch cross-platform divergence for rule mismatches\n- Size trades to expected slippage, not conviction\n- Log outages, halts, and data glitches\n\nThe edge is often operational, not predictive.”,
“description”: “List practical takeaways: avoid thin markets, confirm settlement terms, watch divergence, size trades to slippage, log platform incidents.”
},
{
“subheading”: “What not to conclude”,
“content”: “A market price is a crowd estimate under constraints, not a fact. Treating it as certainty is how you confuse probability with inevitability.\n\nDon’t overreact to one candle on low depth. Don’t ignore spreads when you backtest "signals" from prints you couldn’t have filled.\n\nHeadlines also don’t prove causality. A rumor and a dip can coincide while liquidity, positioning, or platform limits did the real work.\n\nTrade the structure you can measure, not the story you want to be true.”,
“description”: “Explain anti-patterns: treating price as certainty, overreacting to single candles, ignoring liquidity, or assuming causality from headlines.”
}
]
Put the Metrics to Work Before You Trust the Odds
- Start with market quality: confirm liquidity, volume context, continuity, and unambiguous settlement rules before analyzing price.
- Read probability with friction in mind: treat implied probability as a snapshot, then check spread/slippage and depth-at-levels to gauge how “real” that snapshot is.
- Separate trend from noise: compare realized volatility with the news cycle, and note time-to-resolution so you don’t overweight short-term swings.
- Cross-check for integrity: look for cross-market divergence, then assess price discovery speed, trader concentration, and platform risk to understand why markets disagree.
- Write the interpretation, not the narrative: state what the metrics support, what they don’t, and what evidence would change your view.