
 Best Platforms
 Live Odds








9 Prediction Market Comparison Mistakes That Cost You an Edge
A practical troubleshooter for comparing prediction markets without losing edge—define “edge” vs odds, audit outcome and resolution wording, factor in rules/fees/liquidity, and time comparisons around volatility and event risk.
If you’ve ever spotted a “cheap” contract on one venue and a “rich” one on another, you know the feeling: it looks like free money—until you read the fine print or try to fill your order.
This troubleshooter helps you compare markets the way a sharp trader does: starting with edge, then systematically checking outcomes, rulebooks, fees, liquidity, and volatility. You’ll get quick self-checks and concrete fixes so your comparisons reflect what you can actually trade and settle.
Edge First, Not Odds
In prediction markets, “good odds” can still be a bad trade. Your edge is whatever expected value remains after fees, spreads, slippage, and the time your capital stays locked.
What “edge” means
Edge is your expected value after every friction hits your order. That includes fees, spread, slippage, and the time-to-resolution cost of tying up cash.
Imagine two markets priced the same but one has wider spreads and slower settlement. Your quoted edge evaporates before you can recycle capital.
If you don’t price frictions in, you’re comparing optimism, not opportunity.
Quick self-check
Use this list to catch comparison errors before they tax your edge.
- You change size based on platform, not conviction
- You discover fees only after placing orders
- You compare different outcome definitions as “the same bet”
- You assume instant fills in thin markets
- You get surprised by settlement timing or disputes
If two markets don’t behave the same, your “price comparison” is just decoration.
Your troubleshooting map
Comparison mistakes hide in one variable at a time. Fix them with a tight diagnostic loop.
Isolate one variable per test, like fees or settlement rules. Verify it in the market’s written terms, then place small orders to observe real execution.
Document what you learn, or you’ll re-pay the same tuition later.
Mistake 1: Different Outcomes
Two prediction markets can look identical and still resolve differently. The trap is hidden in definitions, dates, jurisdictions, and measurement sources.
Imagine two “Will X happen in 2026?” markets. One uses UTC and an agency release. The other uses local time and an admin judgment call. Even if a discovery site like inabit shows you both prices side by side, you still have to confirm you’re comparing the same contract—because “same headline” doesn’t guarantee “same outcome.”
Resolution wording audit
You’re not trading the headline. You’re trading the exact resolution rule.
- Copy the full resolution text into your notes.
- Mark every defined term, date, timezone, and jurisdiction.
- Highlight ambiguous phrases like “by,” “announced,” or “officially.”
- Find the fallback clause for missing or conflicting sources.
- Write a one-sentence “will resolve YES if…” definition.
If you can’t write that sentence cleanly, you don’t have a contract. You have a vibe. And if you’re using an aggregator to scan multiple platforms quickly, this is the step that keeps “fast comparison” from turning into “fast mistake.”
Source hierarchy check
Resolution sources decide winners. Your edge dies in the footnotes.
- Official agency publication
- Court ruling or legal decision
- Exchange admin determination
- “Best available information” clause
- Manual dispute process
If the hierarchy differs, the prices aren’t comparable. They’re different games. This is especially easy to miss when you’re browsing trending markets across venues in one view—so treat the source hierarchy as part of the price, not fine print. If you’re deciding which analytics tool or scanner best supports this kind of cross-venue comparison, see Predara vs. MarketsPrediction analysis comparison. If you’re deciding which analytics tool or scanner best supports this kind of cross-venue comparison, see Resolve Markets vs. MarketsPrediction comparison. (For a concrete example of how venue resolution and disputes can work, see Polymarket’s resolution process.)
Fix: normalize the contract
You need one shared event definition before you compare prices. Otherwise, you’re arbitraging language, not probability.
Map each market to a single checklist: exact event, measurement source, cutoff time, and jurisdiction. If both checklists match, compare. If they don’t, either adjust your model to each contract or skip the trade.
Skipping is a position. It’s often the best one—even when a cross-platform scanner makes the “best price” look tempting at first glance.
Mistake 2: Ignoring Market Rules
Market rules aren’t legal boilerplate. They’re part of the payoff function.
Two platforms can list the same question, yet settle differently after a delisting, dispute, or ambiguous outcome. That’s the line that gets crossed.
Rulebook comparison steps
You can’t compare markets until you compare how they end. Rules decide who gets to rewrite the ending.
- Open the market rules and the platform-wide rulebook side by side.
- Note resolution sources, timestamps, and who selects the “official” data.
- Map the dispute window: who can challenge, how, and by when.
- Identify admin powers: delist, pause, edit, void, and override.
- Record unwind paths: cancellation, refund, forced settlement, or partial void.
If you can’t explain the unwind path in one breath, you’re not done.
Red-flag clauses
Some clauses quietly convert a trade into a governance bet. You want those highlighted before you size anything.
- “Sole discretion” on settlement or invalidation.
- Broad “may void” without tight conditions.
- Undefined or shifting resolution data sources.
- Retroactive edits to market wording or criteria.
- Vague dispute standards like “reasonable” or “community consensus.”
When language gets fuzzy, your edge becomes optional.

Fix: rule risk premium
Rule uncertainty is a hidden spread. Price it like you would slippage or counterparty risk.
Imagine two identical markets with different dispute processes. On the messy one, you should require more expected edge to compensate for a bad unwind, a delayed payout, or a surprise interpretation.
If you can’t quantify that premium, take the clearer venue and keep your edge clean.
Mistake 3: Forgetting Fees
Fees quietly rewrite your edge. On tight spreads, they can turn a “good” price into a losing trade.
Imagine buying YES at 0.52 and selling at 0.54. Without fees, that looks clean. With fees, it can be dead on arrival.
Fee inventory
You can’t price a market until you know the full toll booth schedule. Find every fee that touches entry, holding, and exit.
- Trading fee per fill
- Maker/taker or tiered fees
- Spread-inclusive pricing model
- Withdrawal and network fees
- Conversion and funding fees
- Creator royalties or market fees
If you can’t list them in one place, you’re not comparing markets yet.
Break-even math
Compute fees before you trust any displayed probability. Your break-even is about the full round trip, not the entry.
- Write your planned entry: YES or NO, size, and expected fill type.
- Add entry costs: trading fee, spread impact, and any royalties.
- Choose your exit path: sell early or hold to settlement.
- Add exit costs: selling fees or settlement fees, plus withdrawals or conversions.
- Convert the total cost into a break-even price and implied probability.
Your “edge” is the gap after costs, not the gap on the screen.
Fix: compare net prices
Headline prices are marketing. Net-of-fee implied probability is your real comparable.
Compute a net entry probability and a net exit probability for each platform using the same trade plan. Compare those net numbers across markets, not the raw YES price.
Once you standardize on net prices, you’ll spot which markets are truly cheap versus merely cheap-looking.
Mistake 4: Skipping Liquidity
Liquidity decides whether your edge is tradable or theoretical. A thin book can show “better odds” that vanish the moment you try to fill size.
Imagine a contract priced at 52¢ with a 55¢ ask. It looks cheap. Then you discover only a handful of shares sit there, and the next ask is 65¢.
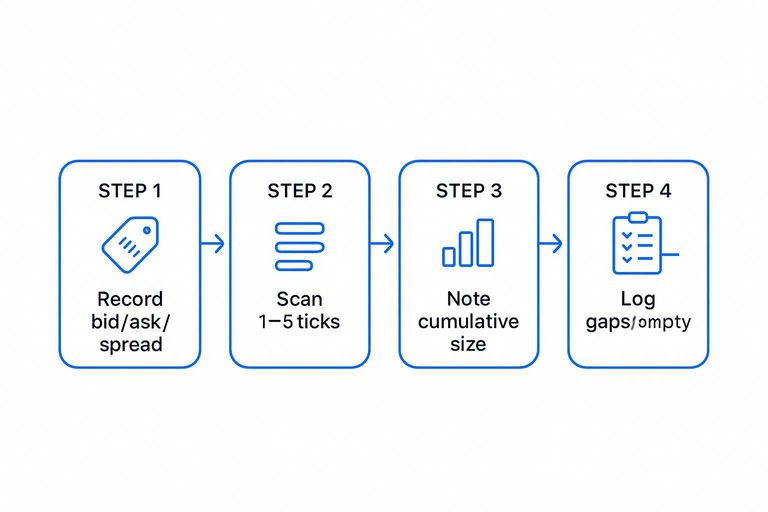
Depth snapshot routine
Check depth like a habit, not a hunch. You want to know what happens after the first fill.
- Record best bid, best ask, and spread.
- Scan depth at 1–3 ticks beyond top of book.
- Note cumulative size at each level.
- Repeat at different times and after trades.
- Log gaps and sudden empty levels.
Hidden liquidity can’t be assumed, so trade what you can see.
Liquidity warning signs
These signals show you’re paying for liquidity, not probabilities. Spot them before you size up.
- Wide spread relative to edge
- Stale quotes that don’t refresh
- Tiny size at top of book
- Fast reversion after small prints
- Sharp impact from small orders
If two show up together, treat the price as marketing, not executable.
Fix: size to depth
Sizing is how you protect edge from your own footprint. Your goal is to keep your average fill close to your thesis price.
Cap size to visible depth near your entry. Split orders across time. Use limit orders to avoid sliding the book.
If you can’t enter without moving price, your edge belongs on a smaller bet. (And when you’re modeling “edge,” don’t forget to incorporate transaction costs—see Kalshi’s transaction fees and fee math.)
Mistake 5: Misreading Volatility
Volatility is not just “how jumpy the line looks.” It’s how far price travels, how fast it gets there, and whether the move sticks.
Compare venues without that context and you’ll call noise an edge. Or worse, you’ll fade real information.
Volatility scan
Fast checks keep you from overfitting one weird hour. You’re looking for speed, distance, and whether shocks decay.
- Check intraday high-to-low range versus typical range
- Measure reaction size after obvious news hits
- Watch mean reversion speed after thin-liquidity spikes
- Track cross-venue divergence persistence, not just appearance
If divergence lasts through liquidity and time, it’s information, not a glitch.
Event risk calendar
Volatility clusters around catalysts. Map them so your “comparison” isn’t just pre-event versus post-event.
- List known catalysts: releases, deadlines, debates, rulings, votes.
- Tag each catalyst with a likely volatility window: before, during, after.
- Decide your stance: trade the run-up or wait for resolution.
- Predefine your entry rule: time-based or price-based trigger.
- Re-check liquidity near the window, then place or pass.
Your edge is often picking the right side of the announcement, not the right venue.
Fix: time your comparison
Cross-venue comparisons fail when you sample different moments. One venue can be mid-spike while another has already mean-reverted.
Sync timestamps and use a consistent window, like a fixed interval around the same reference time. That’s how you avoid chasing transient “mispricings” created by latency, thin books, or a single aggressive order.
When your clock is consistent, the remaining differences are more likely to be real. For a clearer baseline on how “live” odds update from trades and order books/AMMs, see how live prediction market odds work.
Mistake 6: Ignoring Capital Lockup & Settlement Friction
Two markets can show the same price, fees, and even liquidity—and still have radically different capital efficiency.
The mistake is comparing “odds” without comparing how long your money is trapped, how cleanly you can get it back, and how much uncertainty sits between “event happened” and “funds available.” If your capital can’t recycle, your edge is smaller than it looks.
Where lockup hides
Lockup isn’t only “time until the event date.” It’s every delay between now and when your funds are truly usable again.
- Long time-to-resolution: the event is months away, and early exit is costly.
- Settlement lag: the market resolves, but payouts aren’t immediately available.
- Dispute windows: funds sit in limbo while challenges can be filed.
- Administrative pauses: trading halts that block exits right when you need them.
- Withdrawal friction: throttles, batching, queues, or extra steps that add time and uncertainty.
If two venues offer the same contract but one routinely turns a clean win into a waiting game, that difference is part of the price.
The capital-efficiency check
When you compare prediction markets, include a “capital timeline” alongside your fee math.
- Estimate how long you expect to hold (best case and worst case).
- Write down your most likely exit: sell early, hold to resolution, or hedge elsewhere.
- Identify every gate that can delay your exit or payout: disputes, pauses, settlement, withdrawals.
- Assign each gate a simple penalty in your process: either a higher required edge or a smaller size.
You’re not trying to predict the exact delay. You’re preventing a cheap-looking price from quietly becoming an expensive allocation.
Fix: compare returns per unit time, not just price
A small edge that turns over quickly can beat a larger edge that locks up capital.
When two platforms list comparable contracts, evaluate them on the same trade plan and ask:
- If I win, how soon can I redeploy this capital?
- If I’m wrong (or need to exit), how reliably can I unwind?
- How much extra edge do I require for longer or messier lockups?
Once you frame it this way, “best odds” becomes “best odds for the time and friction I’m buying.” That’s the comparison that protects your edge.
Run This 5-Minute Edge Check Before You Compare Again
- State your edge in one sentence: what you believe, why it’s mispriced, and what would make you change your mind.
- Normalize the contract: confirm both markets resolve to the same outcome, same wording, same source hierarchy.
- Price the rules: scan for red-flag clauses and apply a “rule risk premium” if settlement is ambiguous or discretionary.
- Compare net, not headline: subtract all fees/rebates and compute your break-even price on each venue.
- Size to depth and timing: take a depth snapshot, place size where it can fill without moving price, and re-check around known event-risk windows.
Frequently Asked Questions
- When I compare prediction markets, should I compare implied probability or expected value after fees and slippage?
- Compare expected value after fees, spreads, and realistic fill prices, not just the headline implied probability. Use the order book (or recent trades) to estimate what you’d actually pay/receive at your size.
- How do I compare prediction markets for the same event across platforms when one uses binary shares and another uses a different payout model?
- Convert everything to the same payoff basis (usually “profit per $1 at risk” and max payout) and confirm the settlement currency and payout conditions. If you can’t express both markets as the same payoff curve, they’re not directly comparable.
- What metrics matter most when I compare prediction markets beyond odds, fees, and liquidity?
- Look at open interest/active positions, trader concentration (if visible), time-to-expiry, and the quality/latency of the resolution source. These factors affect how stable the price is and how reliably it reflects new information.
- How do I track price movement and volatility differences when I compare prediction markets across sites?
- Use each platform’s price history (or export/API if available) and compare the size and frequency of moves around the same news timestamps. Pay special attention to gaps between last trade and midprice, since thin trading can fake “volatility.”
- Is there a fast way to compare prediction markets across platforms without opening five tabs?
- Yes—use an aggregator that lists the same event across platforms with live odds and activity so you can shortlist where to dig into rules and the order book. inabit can help you scan cross-platform prices and volume in one place before you verify market definitions and fees on the native platform.