
 Best Platforms
 Live Odds








How Next US President Markets Work: Advanced Pricing Signals
An advanced pillar guide to how Next US President prediction markets price outcomes—decode contract taxonomy and venue mechanics, convert prices into probabilities with bias checks, read liquidity/depth and news absorption, and validate signals with cross-market consistency, manipulation filters, and risk-premium decomposition.

If you’ve ever watched “Yes” prices jump after a headline and wondered whether the market learned something—or just got pushed around—you’re not alone. Election prediction markets look simple on the surface, but the most useful signals hide in the plumbing: contract definitions, order flow, and who’s trading.
This pillar breaks that plumbing down so you can interpret pricing moves like a practitioner. You’ll learn how to translate quotes into probabilities, spot microstructure distortions, test liquidity and resilience, map news to event-time reactions, and sanity-check everything across venues before you trust the signal.
Market Microstructure Map
Next US President markets are not one market. They are a stack of contract definitions, settlement rules, and trading mechanics.
Your pricing signals come from where those layers line up. Your distortions come from where they don’t.
Contract taxonomy
Different contract shapes turn the same political belief into different trades. The payout rule decides what “fair value” even means.
- Binary winner-take-all: pays $1 or $0
- Margin-style exposure: tracks mark-to-market swings
- Party-control bundles: links correlated races and seats
- Conditional markets: price given an event happens
- Multi-outcome fields: distributes probability across many names
Watch where intuition breaks. That’s where mispricings survive longest.
Settlement edge cases
Settlement is the hidden volatility. When “who won” becomes a legal process, the contract trades like a litigation option.
Most edge cases cluster into a few recurring uncertainties:
- Call timing: AP call, state certification, or Congress
- Recounts: narrow margins prolong resolution
- Faithless electors: rare, but contract-relevant
- Replacement scenarios: withdrawal, death, substitution
- Court interventions: injunctions, ballot access, counting rules
If settlement language is fuzzy, price becomes a referendum on the rulebook, not the race.
Venue mechanics
The same belief trades differently across venues. Mechanics determine slippage, spoofability, and how noisy the tape looks.
| Mechanic | Price formation | Main friction | Common distortion |
|---|---|---|---|
| Central limit order book | Best bid/ask | Queue priority | Spoofable top-of-book |
| AMM (bonding curve) | Pool-implied price | Curve slippage | Small trades move price |
| High fees | Wider effective spread | Fee drag | Overstates conviction |
| Withdrawal/custody limits | Capital trapped | Transfer delay | Segmented pricing |
When you compare prices, compare microstructure first. Otherwise you’re averaging apples and levers.
Participants and motives
Participants don’t just disagree on probability. They disagree on purpose, and purpose leaves fingerprints.
Hedgers usually trade to reduce exposure elsewhere, so they accept worse prices and trade in chunks. Speculators hunt mispricings, so they probe liquidity and fade overreactions.
Partisans often buy narratives, not odds, which shows up as persistent one-sided flow. Market makers quote both sides, then widen fast when news risk spikes.
Manipulators seek the screenshot, not the settlement, so they target thin books and visible prices. If you can’t explain the motive, you can’t trust the signal.
Price as Probability
A contract price is a compressed statement about odds, but it is not a clean forecast. To use it well, you have to turn quotes into probabilities the way you could actually trade them, after frictions.
Implied probability math
Quotes tell you what you can buy and sell now, not what the crowd “believes” in the abstract.
- Use best ask for “buy yes” probability, and best bid for “sell yes” probability.
- Ignore last trade unless the book is empty or stale.
- Compute the midpoint only as a reference, not a tradable number.
- Convert to a range: bid-derived probability to ask-derived probability.
- Adjust the range for fees, rebates, and expected slippage.
Treat the spread as your uncertainty tax, because it is.
Microstructure biases
Market prices can look precise while the order book is doing guesswork. When spreads are wide, depth is thin, or ticks are coarse, the displayed price can exaggerate certainty.
Imagine a 1-cent tick market with two contracts of depth. One small order can move the quote several “probability points” without any new information. The price moved, but belief did not.
No-arbitrage checks
Simple identities catch broken pricing fast, but they also flag harmless noise.
- Complements: Yes + No should be near 1, after costs.
- Multi-outcome closure: all mutually exclusive outcomes should sum near 1.
- Bundle parity: a packaged payoff should match its legs.
- Cross-market parity: equivalent wording should price similarly.
- Fee-aware bounds: violations must exceed friction to matter.
If the “arb” disappears at the size you can trade, it was just liquidity talking.
Calibration mindset
A market can be directionally right and still be a bad trade for you. Calibration is about whether events that trade at p happen about p of the time, but your P&L also depends on costs, sizing, and how often you can capture mispricing.
Under transaction costs, “well-calibrated” becomes conditional. It means calibration holds after you model the prices you can actually hit, at the sizes you can actually execute. Forecast skill and execution skill are different jobs. (See evidence on well-calibrated probability forecasts.)
Liquidity and Depth Signals
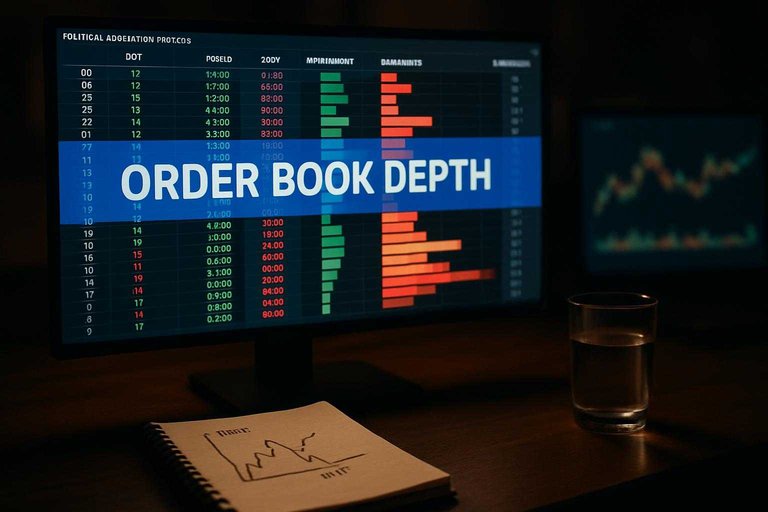
Order books tell you more than prints, especially in political prediction markets. Depth, imbalance, and refill behavior separate informed repricing from noise-chasing. Read the book like a living organism, not a static screenshot.
Depth profile reading
Depth is not just “how much is at the best bid and ask.” You care because shallow books can print “new prices” without real conviction.
- Compare top-of-book with cumulative depth
- Scan for depth cliffs near round levels
- Infer hidden liquidity from repeated refills
- Track imbalance across several price levels
- Treat empty ladders as fragility
Depth cliffs are where small orders become big information by accident.
Impact vs information
A move can be real, or it can be just impact. You care because mechanical slippage often fades once the book rebuilds.
Imagine a market where a medium sweep pushes the price several ticks. If price mean-reverts after the sweep and the book refills fast at prior levels, you likely saw impact, not new beliefs. If price holds and refill shifts upward, you likely saw information.
Watch what happens after the trade, not during it.
Resilience tests
Resilience is how quickly the book heals after stress. You care because healthy markets absorb flow without changing the story.
- Conceptually sweep multiple levels, not just the top.
- Pause and watch whether quotes return at prior prices.
- Measure refill speed and whether size returns symmetrically.
- Note if the mid drifts while “refill” appears.
- Repeat after a second shock to check fatigue.
If refill returns higher and thinner, the market is repricing, not recovering.
Time-of-day regimes
Liquidity is a regime, not a constant. You care because thin periods turn ordinary flow into dramatic prints.
News-cycle clustering often creates bursty books: deep for minutes, then hollow. Weekends can introduce liquidity holes, where small trades move the mid. Debate nights add two-sided uncertainty, with rapid cancels and spoof-like flicker that makes depth look larger than it is.
In thin regimes, downweight depth signals and lean more on persistence after refill.
News Absorption Patterns
Political markets don’t “react to news.” They price a timeline of surprises, leaks, and second-order interpretations.
Trade the digestion process, not the headline.
Subsections: [
{
“subheading”: “Event-time mapping”,
“content”: “Most events have a known clock, so price moves before the fact.\nYou’re watching three regimes: drift, jump, and decay.\nImagine a debate scheduled for 9pm; the last clean repricing often happens earlier.\n\nPre-announcement drift: positioning, hedging, and information leaks set the slope.\nAnnouncement jump: fastest players hit stale quotes, then liquidity refills.\nPost-event decay: slower re-reads, cross-market checks, and mean-reversion trades fade extremes.\n\nYour edge is often identifying which phase you’re in before you press size.”,
“description”: “Pre-announcement drift, announcement jump, and post-event decay; relate each phase to who trades when.”
},
{
“subheading”: “Poll release translation”,
“content”: “Polls are inputs, not outcomes, so translation errors dominate.\nTreat every release as a model update with fragile assumptions.\n\n- Adjust for house effects before reading the delta.\n- Check likely-voter screen versus registered-voter sample.\n- Reconcile turnout assumptions with the election calendar.\n- Map margin changes to plausible EV paths, not point estimates.\n- Sanity-check against state priors and correlated states.\n\nIf your poll-to-EV mapping feels “clean,” you’re probably overfitting noise. For a trader-focused comparison of how to read market probabilities versus model outputs in practice, see US Senate prediction markets vs polling models.”,
“description”: “House effects, likely-voter screens, and turnout assumptions; map poll deltas into expected EV shifts cautiously.”
},
{
“subheading”: “Debate and speech shocks”,
“content”: “Debates create volatility bursts, then a slower narrative auction.\nYou need a rule that stops you from trading the loudest minute.\n\n1. Mark the first 5–10 minutes as pure liquidity stress.\n2. Wait for immediate post-event clips to set the first narrative.\n3. Recheck pricing after cross-venue alignment and volume normalizes.\n4. Re-evaluate after overnight analyst framing and campaign responses.\n5. Size only when the move persists through a second reading window.\n\nYour goal is to trade the repricing, not the performance.”,
“description”: “High-volatility minutes, delayed interpretation, and narrative reversals; propose a disciplined window for reading the true reprice.”
},
{
“subheading”: “Legal and procedural news”,
“content”: “Legal news rarely changes probabilities in one clean step.\nIt changes the width of outcomes first, then the midpoint later.\nCourt calendars, ballot deadlines, and convention rules introduce path dependency, so market makers protect themselves.\n\nIndictments increase headline volatility, but the real variable is process risk.\nBallot access fights and procedural rulings create discrete branches, not smooth updates.\nAs schedules slip or accelerate, implied timelines change, and spreads widen.\n\nWhen spreads widen without midpoint movement, uncertainty is the tradeable asset.”,
“description”: “Indictments, ballot access, convention rules, and court schedules; explain why uncertainty widens spreads before it moves midpoints.”
}
]
Cross-Market Consistency
Related markets let you test whether a price is signal or noise. You compare them to spot distortions, not to assume perfect arbitrage. Imagine the presidency contract surges while state contracts barely move; that mismatch is the clue. For a quick, platform-by-platform framework, use nine quick checks to compare odds. For a nomination-specific example of how to choose between contract types when you hedge, see nominee vs state markets to hedge.
Bundle triangulation
Use bundles to turn scattered prices into a single, checkable story.
- Translate presidency odds into an implied electoral vote path.
- Back out swing-state win rates that could support that path.
- Compare those rates to swing-state market prices, state by state.
- Reconcile with popular vote and party-control prices for consistency.
- Flag any state where implied odds and traded odds disagree meaningfully.
When three bundles disagree, you found the market doing the analysis for you.
Correlation traps
State outcomes are not independent, so you cannot multiply state win probabilities and call it a day. Shocks cluster, tails bite, and conditional paths matter, like turnout shifts that move several states together.
A cleaner mental model is scenario-first: define a few macro states of the world, then price states conditionally. Your “edge” often hides in those conditionals, not in the marginals.
When divergences matter
Not all price gaps mean information. You need to classify the divergence before you trade it.
- Liquidity-driven: wide spreads, thin depth, jumpy midpoints.
- Narrative-driven: synchronized moves on headlines, fast mean reversion.
- Information-driven: gradual drift, tight spreads, persistent re-pricing.
Your job is to decide whether the gap is a payment for risk, or a gift.
Cross-venue frictions
Gaps persist because venues are not interchangeable. KYC gates who can trade, funding rails slow rebalancing, position limits cap size, and settlement definitions can differ in ways that matter.
Treat cross-venue spreads like basis trades in finance: sometimes they are real opportunity, often they are rent for constraints. If you cannot carry the position through settlement cleanly, the “free money” was never free.
Manipulation and Noise
Next-president prediction markets are easy to nudge, especially when liquidity is thin and attention is high. Your job is to treat the tape like a debate clip: useful, but often edited for effect.
Common manipulation patterns
Thin books invite cheap theatrics because small orders can change the story on screen.
- Spoofing depth: big bids appear, then vanish near touch
- Wash-like bursts: rapid back-and-forth prints, little net position change
- Stair-step prints: repeated small buys, steadily lifting last trade
- Quote stuffing: many updates, frozen spreads, delayed real response
If the book looks loud but the position change looks quiet, assume performance art.
Attribution heuristics
You can’t read intent directly, but you can read fingerprints in the flow. The goal is separating real re-pricing from staged urgency.
Organic flow often shows a natural mix of sizes, irregular timing, and follow-through. Staged flow often clusters at the same sizes, repeats at neat intervals, and snaps back after it grabs attention.
Treat “immediate reversal after attention” as a smell test, not a conviction.
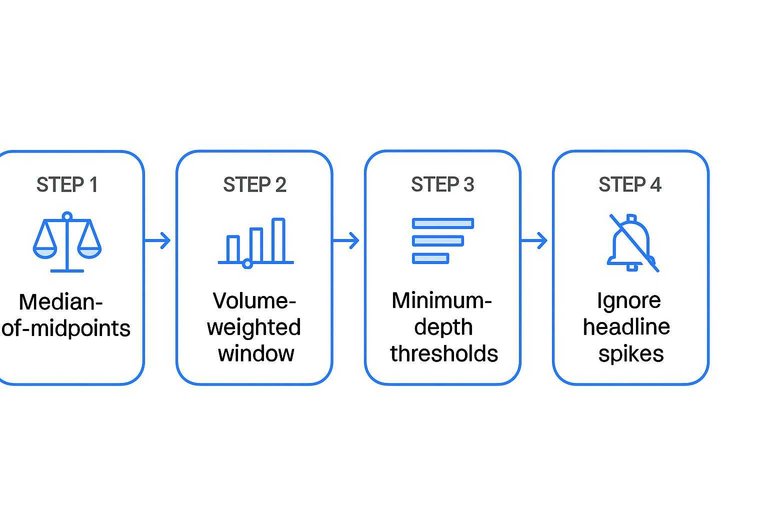
Robust signal filters
Build your signal to survive bad prints and empty depth.
- Use a median-of-midpoints, not last trade, for your core price.
- Apply a volume-weighted window so tiny prints don’t dominate.
- Enforce minimum-depth thresholds before trusting tight spreads.
- Ignore the market during headline spikes until depth and spreads normalize.
When your filters say “no trade,” you’re not missing action; you’re dodging noise.
Reflexivity feedback loops
Sometimes the price stops reflecting belief and starts creating it. A screenshot goes viral, a pundit cites the move, and new money arrives to “confirm” the narrative.
Leaderboard effects amplify this: traders chase what’s moving because movement itself attracts liquidity and attention. Price becomes the marketing channel.
Watch for the moment the market begins trading its own coverage.
Risk Premium Decomposition
Prediction-market prices look like probabilities, but they also carry a risk premium. Traders face funding frictions, utility quirks, and hedging motives that push prices away from “true odds.”
That wedge is not noise. It is the market’s bill for holding the risk.
Risk aversion wedges
Some traders do not value one more dollar the same in every state. They pay up for payouts that feel better, even if expected value is worse.
Longshot bias: traders overpay for small-chance payoffs. Favorite–longshot effect: favorites get slightly discounted while longshots get bid up. Skew preference: traders prefer lopsided upside over balanced outcomes.
If you see persistent overpricing of tails, you are seeing utility, not information. (Related microstructure evidence is summarized in microstructure evidence from the Polymarket order book.)
Funding and carry
Even “binary” contracts have financing costs. When capital is scarce, carry shows up as price drift and term-structure gaps.
- Capital lockup raises required edge
- Opportunity cost shifts fair value down
- Borrowing constraints block arbitrage
- Margin rules amplify maturity spreads
- Inventory limits create sticky mispricings
When maturities disagree, first suspect balance sheets, not beliefs.
Hedging demand
Sometimes people buy contracts to offset life risk, not to “bet.” That demand is price impact without new information.
Partisan hedges: you buy the outcome you fear. Portfolio insurance: you pay for convexity when other assets crash. Correlated exposures: your income, sector, or region moves with the election.
A one-sided hedge wave can move price like a headline, while nothing new happened.
Practical adjustment frame
Treat the quote as probability plus a wedge. Your job is bounding the wedge before you treat the price as a forecast.
- Start with mid-price as the baseline probability.
- Use bid–ask width to set a minimum wedge band.
- Check depth to see how fragile that mid really is.
- Compare close substitutes across venues and maturities.
- Rebound your estimate when wedges explain the gap.
You are not “correcting” the market. You are pricing the distortion.
Signal Quality Scorecard
You need a fast way to tell “information” from “noise” when prices jump. This scorecard rates a move using only observable tape, books, and context.
| Dimension | What to check | Strong signal | Weak signal |
|---|---|---|---|
| Depth & spread | Book thickness, spread | Tight, deep | Wide, thin |
| Prints | Trade size, clustering | Repeated, consistent | Single odd lot |
| Cross-market | Related contracts move | Broad alignment | Isolated tick |
| Timing | Calendar, headlines | Clean catalyst | Random hour |
| Reversion | Giveback speed | Holds level | Snaps back |
Treat high scores as a cue to investigate, not a cue to bet. Your next step is always: “What changed, and where else should it show up?”
Put a Repeatable Read on the Tape
- Start with the contract: confirm the exact settlement rule, edge cases, and venue mechanics before interpreting any move.
- Convert price to probability, then stress-test it: check implied math, identify microstructure biases, and run quick no-arbitrage sanity checks across related contracts.
- Validate the move with liquidity context: read depth/impact, test resilience, and account for time-of-day regimes.
- Map catalysts in event time: compare the reaction to polls, debates, speeches, and procedural/legal news to judge information vs noise.
- Close with quality control: triangulate across venues/bundles, apply manipulation/noise filters, and adjust for risk premia—then score the signal with the scorecard before acting.
Frequently Asked Questions
- Are next US president markets more accurate than polls for predicting who wins?
- They’re often a useful complement, not a replacement. Markets aggregate money-weighted beliefs and react quickly to new information, while polls measure voter sentiment and can be more representative but slower to update.
- What’s the safest way to use next US president market prices without overreacting to day-to-day swings?
- Treat prices as a noisy signal and focus on persistent moves across multiple sessions plus corroboration from polls, fundraising, and major news events. Avoid drawing conclusions from single headline spikes or thin-liquidity jumps.
- Can I compare next US president odds across different prediction markets like Polymarket and Kalshi?
- Yes, but compare like-for-like contracts (same winner definition, settlement rules, and event scope) and account for fees and liquidity differences. When prices diverge, the gap often reflects market frictions and participant mix more than “free money.”
- What should I watch besides the headline price to judge next US president market confidence?
- Look for whether the move is supported by sustained volume, tighter spreads, and follow-through after the initial news cycle. Also check if related markets (party control, swing states, nominee markets) shift in the same direction.
- Do next US president prediction markets still matter in 2026 with more election forecasting models available?
- Yes—markets provide an independent, real-time consensus that can validate or challenge model outputs. They’re most valuable when you use them as one input alongside forecasts, polling, and on-the-ground fundamentals.