
 Best Platforms
 Live Odds







How Prediction Market Comparison Works: Odds, Volume, Liquidity
An explainer on how prediction market comparison really works—treat odds as prices, interpret volume without confusing it for belief, and use liquidity (spreads, depth, and price impact) as the fairest way to compare markets across venues.
If you’ve ever tried to compare prediction markets, you’ve probably stared at odds, volume, and “liquidity” labels and still felt unsure which market is actually better to trade. Tight odds can hide thin books, big volume can be pure churn, and two platforms can quote the same price while offering very different execution.
This explainer shows you what each metric really means under the hood—how pricing is formed, where volume comes from, and how to judge tradability—so you can compare markets on what matters: the cost and reliability of getting in and out.
Comparison Basics
Prediction markets look simple because they show a number that feels like an “odds” readout. They’re harder because each venue packages belief, risk, and trading friction in different ways, so two screens can disagree without either being “wrong.” Comparing them well means separating price signals from how easy it is to actually trade them.
Odds As Prices
Odds in prediction markets are prices for a contract that pays if an outcome happens. That price maps to an implied probability, but the market can display several competing “prices” at once.
A typical read is:
- Contract price → implied probability (e.g., $0.62 ≈ 62% before adjustments)
- Bid and ask → the tradable range right now
- Last trade → the most recent match, not the current clearing price
- Midpoint → a convenience estimate, not guaranteed executable
If you quote a single odds number, you’re usually quoting a shortcut, not a tradable truth.
Volume Isn’t Belief
Volume is tempting because it looks like “how much the market cares.” It mostly measures turnover, which can come from many motives.
- Counts how much traded, not who holds risk
- Mixes hedging, arbitrage, and speculation
- Hides net positioning across sides
- Ignores resting orders that never filled
- Misses conviction behind untraded intent
If you want belief, look for where price can’t be moved cheaply, not where prints happened often.
Liquidity Is Tradability
Liquidity is how costly it is to trade right now without moving the market against you. It’s the difference between “the market says 60%” and “you can actually buy at 60%.”
Liquidity shows up as:
- Spread: the immediate cost to cross from bid to ask
- Depth: how much you can trade near the current price
- Price impact: how far price moves as you size up
When two markets show the same probability but different liquidity, they are not equally informative for comparison.
Three Common Traps
Bad comparisons usually come from reading one visible number and ignoring the microstructure underneath.
- Comparing last price instead of bid/ask
- Treating high volume as higher accuracy
- Ignoring fees, limits, and constraints
The clean move is to compare executable prices for a common trade size, venue by venue.
Odds Under The Hood
Displayed odds are a translation layer, not a direct readout of belief. Different market designs map the same buy and sell intentions into different prices and different “best available” odds. If you compare markets, compare the mechanism first, then the number.
Order Book Mechanics
Order books turn intentions into prices through queued limit orders. That matters because the displayed odds are often just the next executable price.
You place a limit buy at your price, or a limit sell at your price. The best bid is the highest buy; the best ask is the lowest sell. The midprice sits between them, but you trade at bid or ask.
Thin books are where comparisons break. One small market order can chew through the top level and print a very different last price.
AMM Pricing Curves
AMMs turn trades into prices with a formula instead of a queue. That matters because the odds move continuously, even when nobody is waiting with orders.
You trade against a pool that holds inventory of each outcome. As the pool gets imbalanced, the curve becomes more sensitive and the marginal price shifts. Small trades look smooth, but size introduces slippage as you move along the curve.
So the screen can look calmer while your large order pays up fast.
Resolution And Payouts
Resolution rules change what the contract is worth, even before any trading happens. Price follows the payoff, not the vibe.
- Contract definition and exact wording
- Edge cases and ambiguous outcomes
- Settlement timing and payout delays
- Counterparty, escrow, and default risk
If two markets resolve differently, “same odds” is a category error.
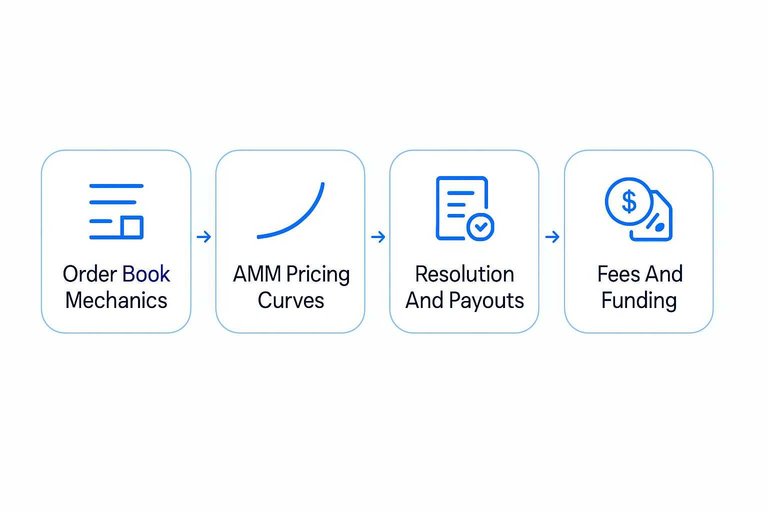
Fees And Funding
Fees and collateral rules change your real break-even price. That matters because the displayed odds ignore the frictions you actually pay.
Trading fees widen your effective spread, especially for frequent rebalancing. Withdrawal costs can trap value and force extra trades. If collateral is locked or financed, the opportunity cost becomes part of the position.
When you compare markets, convert odds into net odds after frictions. That’s the tradable truth.
Volume Interpreted Correctly
Volume is easy to compare and easy to misread. It shows how much trading happened, not why it happened or who learned what.
Turnover Sources
Volume comes from different behaviors, and each one implies a different story. You want to separate information trading from mechanical churn.
- Hedging exposure from other bets
- Arbitrage across venues or contracts
- Market making inventory rebalancing
- News-driven repricing after updates
- Incentive-driven wash-like churn
High volume is only bullish for “information flow” when it’s not mostly recycling.
Open Interest Proxy
Turnover can be huge even when nobody stays exposed. Outstanding positions, or their closest equivalent, show who is still holding risk.
When open interest rises, traders are committing capital to a view. When it stays flat while volume spikes, you are watching hot-potato trading. That gap tells you whether participation is sticky or just noisy.
Time Window Effects
A time window can make the same market look liquid or dead. “24h volume” rewards bursts, while “all-time volume” rewards age.
Pre-event hours often compress activity into a surge. Quiet periods can hide a healthy book that simply lacks new catalysts. Compare windows only when the event clock and news cadence match.
What To Pair With Volume
Volume is useful when you treat it as one instrument in a panel. Pair it with signals that reveal who traded and what it cost.
- Unique traders over the window
- Depth snapshots near midprice
- Bid-ask spread history
- Midprice volatility over time
If volume rises while spreads tighten and depth grows, participation is probably real.
Liquidity: The Real Comparator
Liquidity is the cost to move probability, not the ability to place a bet. You compare venues by asking one question: how expensive is it to change the displayed odds by trading.
Spread And Midprice
Spread is your immediate toll for trading right now. In prediction markets, it is the gap between buy-odds and sell-odds.
On thin markets, the last trade can be stale or accidental. Use the midprice instead.
Mental model:
- Best bid = what others pay to buy your shares.
- Best ask = what you pay to buy shares.
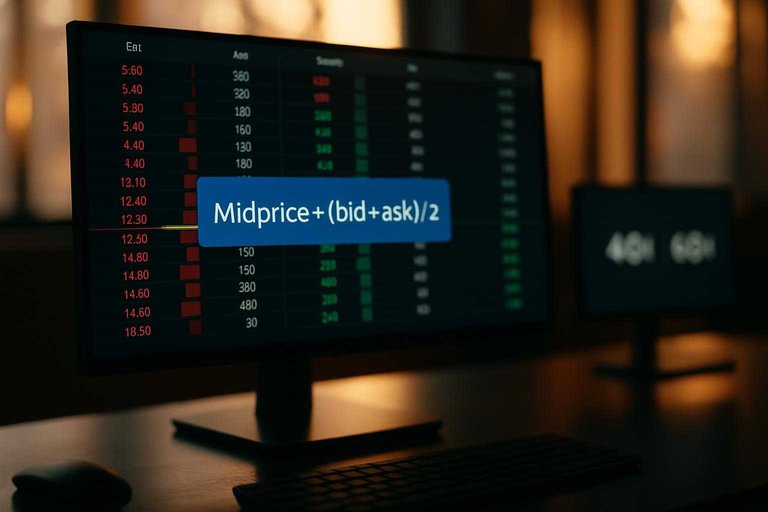
- Midprice = (bid + ask) / 2.
- Spread = ask − bid.
Imagine a contract shows 40¢ bid and 60¢ ask. The last trade prints at 60¢.
The last trade screams “60%.” The midprice says “50%.”
Treat last trade as a receipt. Treat midprice as the market’s current consensus.
Depth At Levels
Depth tells you how much probability you can buy or sell before price moves. It’s the first check when comparing “tight” markets.
- Size at best bid and ask
- Cumulative depth within X cents
- Depth curve shape across levels
- Gaps between adjacent levels
- Refill speed after trades
If depth disappears two ticks down, your “liquid” market is just a thin facade.
Price Impact
Price impact is what happens to odds after you trade a fixed size. It is the cleanest expression of “cost to move probability.”
In a deep book, a $size order barely nudges the midprice. In a thin book, the same order walks levels and rewrites the odds.
Not all impact is bad. Some moves reflect real information arriving through your trade.
The trick is separating information from emptiness. If impact reverses quickly, you hit thinness, not truth.
Liquidity Over Time
Liquidity is episodic because attention is episodic. A market can look deep at noon and hollow at midnight.
Use both snapshots and time windows.
- Snapshot: spread, depth, and impact right now.
- Average: typical spread and typical depth across hours or days.
- Worst-case: what it looks like during stress.
News shocks often widen spreads and pull depth as makers manage risk. Then liquidity returns, but not always at the same prices.
So compare venues on the moments you actually trade, not the moments that look good in a screenshot.
Normalization Checklist
Comparing prediction markets breaks fast when each venue defines, times, and prices the contract differently. Use this checklist to normalize inputs before you compare odds, volume, or liquidity.
- Match the contract definition across venues, including edge cases and settlement source.
- Align the time window, using the same cutoff timestamp and timezone everywhere.
- Convert all quotes to a single probability scale, after fees and price conventions.
- Standardize trade size, quoting depth and slippage at the same notional.
- Record currency, leverage, and margin rules, then adjust or exclude mismatches.
Once these are aligned, differences start reflecting market beliefs, not measurement noise.
Compare Markets Like a Trader, Not a Spectator
When you compare prediction markets, start by treating odds as a tradable price, not a truth claim; then read volume as activity, not conviction. The deciding factor is liquidity—spreads, depth, and expected price impact over the time you plan to trade. Run the same normalization checklist on every venue (same outcome definition, time window, fees, and sizing assumptions) and you’ll end up comparing execution quality instead of headlines.
Frequently Asked Questions
- Is the best way to compare prediction markets just to look at which one has the “best odds” right now?
- No—headline odds alone can be misleading because they may reflect different fee structures, pricing rules, and how each venue handles order flow. When you compare prediction markets, treat odds as a snapshot and verify what would happen to price if you traded a realistic size.
- How do I compare prediction markets across venues that use different contract types (binary, scalar, multi-outcome)?
- Convert everything to the same probability basis (e.g., implied probability for a single outcome) and make sure you’re matching the same event definition, settlement rules, and time window. If a market bundles outcomes differently, compare at the outcome level rather than the contract label.
- What’s the simplest way to compare prediction markets after fees, spreads, and slippage?
- Estimate your all-in execution price by pricing a small test trade (or using the order book) and adding fees, then compare the net implied probability across venues. This captures real tradability better than displayed odds or raw volume.
- When I compare prediction markets, how can I tell if one venue is being manipulated or just illiquid?
- Look for prices that swing sharply on small trades, large gaps between best bid/ask, and frequent reversals without sustained depth behind the move. Cross-check with other venues and news timing—manipulation claims are less plausible when multiple markets move together on new information.
- Should I compare prediction markets using historical accuracy (calibration) instead of current market metrics?
- Calibration can be useful, but it’s hard to attribute because markets list different questions, horizons, and participant bases. Use accuracy studies as background context, and rely on current execution quality (depth, spreads, and fee-adjusted pricing) for venue selection on a specific trade.