
 Best Platforms
 Live Odds








How to Track Michigan Primary Odds: 7 Steps
A step-by-step guide to tracking Michigan primary odds with confidence — set up your tracking scope, choose and vet sources, normalize odds into probabilities, version updates with context, and publish a simple dashboard for trend-based decisions.

Tracking primary odds sounds simple until you try to compare numbers across different sites, formats, and update times. One hour you’re looking at American odds, the next you’re staring at implied probabilities—and your notes don’t explain what changed or why.
This guide gives you a clean, repeatable system: define your tracking setup, pull official race facts, select and standardize reliable sources, convert odds into comparable probabilities, log updates with version control, and surface the signals in a lightweight dashboard you can share.
Define your tracking setup
Before you track anything, lock your scope and definitions so your numbers stay comparable.
A simple, repeatable workspace beats a clever one. Consistency wins.
Pick the primary contests
Choose the exact contests first so every later log entry matches the same race definition.
- Select party, office, and election date.
- Add district or jurisdiction details, if any.
- Pull the official contest ID from Michigan’s election resources.
- Record the full candidate list as your baseline roster.
- Note any special rules, like withdrawals or substitutions.
If you can’t point to one race ID, you’re tracking vibes.
Choose odds types
Odds can mean different things depending on the source, and that ambiguity will wreck your comparisons.
Pick one primary definition, then map everything else into it.
Use one of these, and write your formulas down:
- Pricing odds: American, decimal, or fractional as published.
- Implied win probability: probability derived from pricing odds.
- Forecast probability: model output from a forecaster.
Common conversions you can standardize on:
- Decimal to implied probability:
p = 1 / decimal_odds. - American (positive) to implied probability:
p = 100 / (american + 100). - American (negative) to implied probability:
p = -american / (-american + 100).
Once you commit to one “truth format,” every source becomes comparable.
Create a tracking sheet
A single sheet keeps you honest, because every row forces the same fields.
- Create columns: timestamp, contest ID, candidate, source, odds, implied probability.
- Add columns: forecast probability, notes, and raw link.
- Add a “data pulled by” field if multiple people log.
- Freeze the header row and standardize time zone.
- Save a blank template copy for reuse.
If you can’t paste a row in 20 seconds, you won’t keep up.
Set update cadence
Your cadence is your measurement frequency, and it determines what trends you can see.
Pick a schedule you’ll actually follow, plus triggers for extra checks.
- Log at a fixed time daily or weekly.
- Add event-driven checks for debates and major endorsements.
- Re-check after candidate filing changes or withdrawals.
- Re-check after credible polling releases in that contest.
- Log immediately when a source changes methodology or market rules.
Cadence is your guardrail against cherry-picked snapshots.
Collect official race facts
Start by grounding your odds log in the exact race, rules, and calendar Michigan is using. That prevents you from tracking the wrong ballot, deadline, or reporting window.
- Confirm the election type and date on the Michigan Secretary of State elections page.
- Pull the official candidate list from the relevant county clerk or state posting.
- Record filing deadlines, withdrawal rules, and certification dates from official notices.
- Save the official precinct and district maps used for this primary.
- Note when unofficial results post and when canvass and certification occur.
If your sources aren’t official and timestamped, your “odds” become opinions on the wrong race. For an extra official-directory cross-check, use the NASS #TrustedInfo election admin directory.
Select reliable odds sources
You need a small, repeatable set of sources, not a sprawling dashboard. Fewer inputs reduce noise, duplication, and the urge to chase every wiggle.
Market vs forecast sources
Markets and forecasts answer different questions, so treat them as separate instruments. Markets reflect tradable prices, while forecasts reflect a model’s probability estimate.
Betting markets can move on news, sentiment, or a few large bets. Forecast models move when inputs change, like polling, fundamentals, or assumptions.
When they diverge, you’re usually seeing “price of risk” versus “best guess.”
Vet source quality
Before you track a source, decide what “good” looks like. Use the same checklist every time.
- Shows clear methodology and definitions
- Updates on a predictable cadence
- Signals real liquidity or participation
- Notes major changes or anomalies
- Stays directionally consistent over cycles
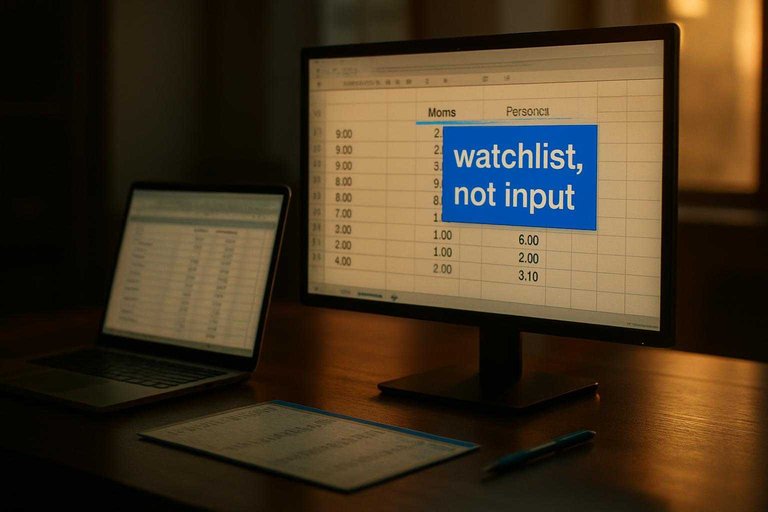
If a source fails two checks, demote it to “watchlist,” not “input.”
Standardize source URLs
Make your tracking sheet frictionless by storing stable, race-specific links. One click should pull you back to the exact page.
- Find the canonical race page URL, not a homepage.
- Remove tracking parameters, like referral tags.
- Store the cleaned URL in a dedicated “Source Link” column.
- Add a second link for the same race, if formats differ.
- Test in an incognito window for access issues.
Low friction beats perfect organization, because you’ll actually keep updating.
Define a primary source
Pick one default source for your headline number, even if you track several. Consistency makes your notes comparable across days.
Override your primary source only for clear reasons, like downtime, missing candidates, or obvious data glitches. Write the override rule once, then follow it.
Your “default” is a contract with your future self.
Normalize odds into probabilities
You can’t compare sources until everything speaks the same language: probability. Convert each price into implied probability, then strip out margin where you can. Otherwise, you’ll chart noise and call it signal.
Convert common formats
Convert odds into implied probability so every row is comparable.
- Add an “Odds format” field per source.
- American: if +A, p = 100 / (A + 100); if -A, p = A / (A + 100).
- Decimal: p = 1 / D.
- Fractional a/b: p = b / (a + b).
- Store the formula text in your sheet notes.
Once formulas are locked, the rest becomes simple math, not judgment.
Handle overround
Bookmakers bake margin into prices, so the raw probabilities usually sum above 100%. If you track a full field, normalize so the total equals 100% for that market snapshot.
That’s the line between “market moved” and “the book repriced.”
Create comparable fields
You need consistent columns so charts don’t mix raw and adjusted numbers.
- Add “Raw implied p” from the odds formula.
- Add “Market total p” as the sum of raw implied p values.
- Add “Normalized p” = raw implied p / market total p.
- Add “Tracking p” with a single rule per source.
Pick one tracking rule and keep it boring. Boring ships. Boring charts.
Flag edge cases
Edge cases create silent breaks in your time series unless you define rules up front.
- Missing odds: leave blank, don’t backfill.
- Suspended markets: mark status, keep last price separate.
- Yes/No props: normalize within that two-way market.
- Two-way vs multi-way: don’t mix in one chart.
- Dead heat or ties: note settlement rules.
Your rules are the dataset. The odds are just inputs.
Log and version updates
Odds move for messy reasons: source changes, roster shifts, and your own spreadsheet tweaks. If you don’t version each update, you can’t defend your chart later.
Snapshot each update
You want every refresh to be reproducible, even months later. Treat each update like a permanent record, not a living cell.
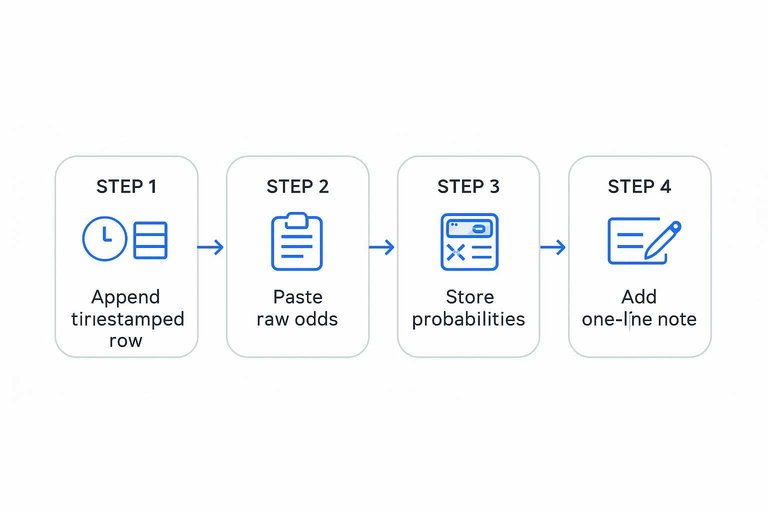
- Append a new row with an exact timestamp.
- Record the source name and URL you pulled from.
- Paste the raw odds as shown, without edits.
- Store your computed probabilities in separate columns.
- Add a one-line note explaining the change or anomaly.
If you ever overwrite a row, you’re choosing amnesia.
Add context notes
Numbers alone don’t explain movement. A consistent note format turns “why did this jump?” into a two-second answer.
Use one line per update:
What: the observable event.
Why: the expected direction or uncertainty.
Link: the trigger URL or doc.
Good notes make your future self fast, not clever.
Track roster changes
Roster churn breaks comparisons if you treat it like a quiet edit. Log it as events so your baseline stays intact.
- Add candidate entry as a dated event.
- Log withdrawals as separate, irreversible events.
- Record endorsements with endorser and target.
- Note disqualifications with a citation link.
- Tie every event back to the baseline roster.
Roster events explain “odds changed” when nothing else did.
Maintain a changelog
You also change the system: sources, formulas, and rules. A lightweight changelog keeps those decisions visible.
- Create a “Changelog” tab with a simple table.
- Log the date and the change you made.
- Note which races or sheets were affected.
- Write the decision and rationale in one sentence.
- Link to any supporting doc or thread.
When results look odd, you’ll know if the math changed or reality did—especially around predictable compliance dates on the FEC calendar.
Build a simple odds dashboard
A dashboard turns your raw log into decisions you can make fast. You want three things visible immediately: trend, volatility, and today’s standings.
Keep it boring and consistent. Same time scale, same colors, same definitions.
Create trend charts
Trend charts answer one question: who is gaining, and how steadily. Use normalized probabilities so candidates stay comparable across sources.
- Choose one time scale and stick to it.
- Normalize each source to probabilities per timestamp.
- Plot one line per candidate, same color everywhere.
- Add a light band for recent volatility, if your tool supports it.
- Annotate known events as vertical markers.
Consistency beats cleverness, because your eye learns the pattern.
Add a current snapshot
A snapshot table reduces scanning time to seconds. Make it sortable so you can catch movement without rereading charts.
| Candidate | Current probability | 7-day change | Source updated |
|---|---|---|---|
| Candidate A | 0.00 | +0.00 | YYYY-MM-DD HH:MM |
| Candidate B | 0.00 | -0.00 | YYYY-MM-DD HH:MM |
| Candidate C | 0.00 | +0.00 | YYYY-MM-DD HH:MM |
| Candidate D | 0.00 | +0.00 | YYYY-MM-DD HH:MM |
If the “updated” column lags, treat the whole snapshot as stale.
Highlight key signals
Signals keep you from eyeballing every wiggle. Define them once, then let the dashboard call your attention.
- Momentum: 3-day slope exceeds your threshold.
- Convergence: sources move closer for 48 hours.
- Divergence: sources spread wider than usual.
- Jump: single update crosses your alert band.
- Stall: no updates beyond your cutoff.
When a signal fires, open the raw log first, not your opinions.
Publish a shareable view
Sharing forces discipline and prevents “private spreadsheet drift.” Your goal is a read-only artifact with provenance baked in.
- Export a view-only link or a locked PDF.
- Freeze the visible date range and time zone.
- Add a footer with timestamp, sources, and method.
- Include a short change log entry for major tweaks.
If someone can’t tell what changed since yesterday, your dashboard is incomplete.
Put Your Tracking on Autopilot
- Lock your scope: contests, odds types, sheet fields, and an update cadence you can sustain.
- Anchor everything to official race facts, then pull odds from vetted sources with standardized URLs and a clear primary source.
- Normalize odds into implied probabilities (handling overround), snapshot every update with notes and a changelog, and roll it into a simple dashboard that shows trends and today’s state at a glance.
Frequently Asked Questions
- Are Michigan primary odds the same as Michigan primary polling?
- No—odds reflect an implied probability based on market pricing or model forecasts, while polls are survey snapshots of voter intent. Odds often incorporate polls plus other signals like fundraising, endorsements, and historical turnout patterns.
- What’s the best way to track Michigan primary odds if I don’t want to use prediction markets?
- Use model-based forecasts and polling aggregators, then log implied win probabilities from each source on a consistent schedule. You’ll get a comparable “odds-style” view without relying on market prices.
- How do I know if Michigan primary odds are being skewed by low liquidity or hype?
- Compare multiple independent sources and watch for sharp moves that aren’t matched by polling, official news, or other models. Thin markets often show bigger, faster swings that reverse quickly when more volume arrives.
- How often should I update my Michigan primary odds dashboard?
- Update on a consistent cadence (daily or a few times per week) and add extra snapshots after major events like debates, endorsements, court rulings, or new polling releases. Consistency matters more than frequency for spotting real trend changes.
- What should I look for in Michigan primary odds besides who’s leading?
- Track momentum (sustained direction), volatility (how jumpy the series is), and convergence/divergence between sources. Those patterns often explain whether the race is stabilizing or still highly uncertain.