
 Best Platforms
 Live Odds








Michigan Primary Markets vs Polls: Which Guides Trades?
A practical comparison for trading the Michigan primary—use a decision framework to interpret prediction markets vs polls, understand market pricing and microstructure, evaluate polling methodology and error, and know when to combine both signals for your time horizon and risk constraints.
If you’ve ever watched a Michigan primary contract whip around while polls barely budge, you’ve seen the core problem: markets and polls often measure different things at different speeds.
This comparison helps you decide which signal should drive your trade in the moment. You’ll learn why the two diverge, what prediction market prices actually imply (and when they’re distorted), how to judge polls by field dates and methodology, and how to combine both into a plan that fits your time horizon and risk limits.
Decision Framework
“Guides trades” means what you let move your order ticket. It’s your default input when you must act with uncertainty.
Michigan primary markets price win probabilities. Polls estimate voter intent from a sample.
If you scalp, guidance is price action. If you hedge, guidance is what breaks your thesis.
What each measures
Markets aggregate beliefs into a probability, because traders must clear at a price. Polls measure stated intent, because respondents answer a question.
Imagine a thin Michigan market after a debate. Price can gap on a few aggressive orders, while polls stay unchanged for days.
That gap is your clue: one measures tradable consensus, the other measures surveyed sentiment.
Why they diverge
Divergence is normal, because each tool has different friction and incentives.
- Timing mismatches across releases
- Liquidity and depth constraints
- Turnout and electorate modeling
- Undecided and late-decider behavior
- House effects and methodology quirks
Trade the driver, not the headline.
Trading time horizons
Your horizon decides which signal updates fastest enough to matter. Short windows reward tools that move continuously.
For very short-term trades, markets usually lead because they reprice instantly. For medium-term swings, polls can dominate once multiple fresh samples agree.
For event-driven hedges, use whichever reacts first, then confirm with the slower one.
Risk constraints first
Set risk limits before you pick signals, because the signal is useless if you can’t hold the trade.
- Define max loss per trade in dollars or ticks.
- Size the position so a stop-out matches that max loss.
- Set an invalidation level tied to a specific scenario.
- Decide your exit rule: time-based, price-based, or both.
- Write the “no-trade” conditions before entry.
If you can’t state invalidation, you’re not trading a view. You’re renting a feeling.
When to combine
Combine when neither source is clean enough alone. That’s common in Michigan, where liquidity can be uneven and polls can be stale.
Start with markets when liquidity is real and spreads are tight. Shift weight toward polls when you have several recent pollster reads, and the market looks jumpy.
Your edge is often in the mismatch window, not in picking a single “best” source.
Michigan Primary Basics
Michigan primaries can move fast because the electorate is smaller and less predictable than November. That volatility hits your signals first, then your risk limits.
Turnout uncertainty
Primaries magnify turnout error because fewer voters decide the outcome and participation varies by party intensity. Pollsters can model likely voters, but small misses in who shows up can flip the result.
Markets react differently. They often reprice on narratives about enthusiasm, field operations, or weather, even when polls stay flat.
If your edge depends on one turnout assumption, you don’t have an edge. You have a fragility.
Voter mix changes
Michigan’s primary electorate can shift inside the final week, even without persuasion movement. Your job is to separate opinion change from composition change.
- Independent participation rate shifts
- Crossover voting incentives and permission
- Weather affecting travel and lines
- Campus calendars and student presence
- Local issues dominating local turnout
Track mix signals like you track price. Composition is the hidden lever.
Timing and rules
Calendar matters because information decays faster when voting starts early or stretches across multiple days. Early voters lock in decisions before late news, while election-day voters absorb the last headline.
Rule nuances can also change how informative a poll is. If participation rules affect who can choose which ballot, your “likely voter” screen becomes the entire trade.
Treat each new poll as time-stamped inventory, not timeless truth. For the specifics, review the state’s absentee voting rules and deadlines.
Late-break risk
Late breaks hurt most when your position assumes a smooth glide path. Plan for shocks, because Michigan can reprice on a single local storyline.
- Define your “shock window” and cap exposure inside it.
- Pre-map triggers: gaffes, endorsements, legal news, health rumors.
- Set conditional actions: hedge, reduce, or add at defined price levels.
- Watch high-velocity channels: local TV, campaign emails, precinct chatter.
- Re-evaluate assumptions after each shock, not just the price.
You’re not predicting the headline. You’re pre-committing to how you’ll trade it.
How Markets Work
Primary and prediction markets turn scattered beliefs into a single tradable price. You trade the price, but you’re really trading the crowd’s current odds, plus the market’s plumbing.
Bad plumbing distorts the signal. Good plumbing turns small bits of information into a usable guide.
Price as probability
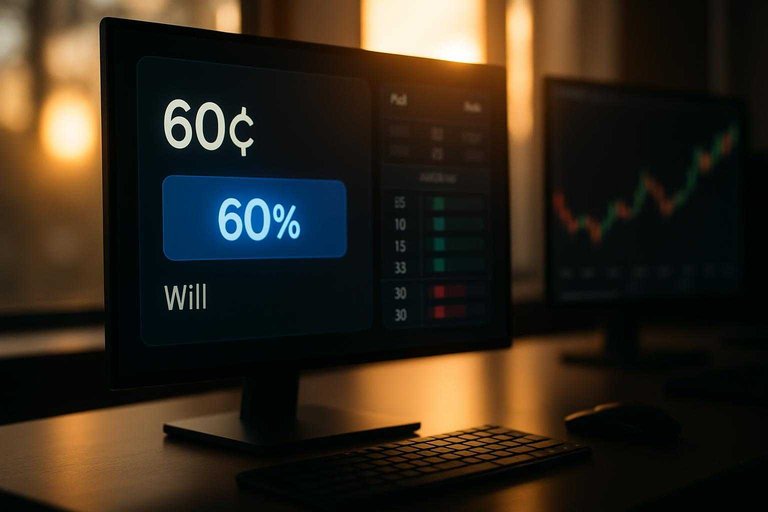
A market price is usually the implied chance of an outcome, not the expected margin. That’s why a 60¢ contract reads as “about 60%,” even if the win could be narrow or huge.
Common misread: treating probability like vote share. Another one: assuming “likely” equals “locked,” then sizing trades like certainty.
Liquidity and slippage
Reliable markets let you trade without moving the price much. You can spot that reliability before you click buy.
- Tight bid-ask spreads most of the day
- Visible depth near the mid price
- Steady volume, not single bursts
- Small orders cause small moves
- Prices update smoothly, not jagged
If a tiny order whipsaws the price, you’re trading a mirage.
Information aggregation
Markets can react to more than polls because traders bring other inputs. Some are measurable, some are vibes, and both can move price.
Think fundraising signals, staffing and field scale, endorsement pipelines, donor chatter, debate expectations, and narrative momentum. When those line up, price can shift before polls do.
Manipulation and noise
Thin markets invite theatrics because it’s cheap to shove the tape. You can often spot the shove with a few quick checks.
- Check order book depth before and after the move.
- Compare the move across similar markets and related contracts.
- Look for a thin-volume spike that prints far from the prior range.
- Watch whether price reverts once real volume returns.
- Re-check spreads to see if liquidity vanished during the spike.
If it snaps back when depth returns, it was probably air, not insight.
Market microstructure flags
Some markets look like probabilities but trade like penny stocks. Those conditions make “the market thinks” a dangerous sentence.
- Wide spreads that persist
- Abrupt repricing with no new catalyst
- Fragmented venues with diverging prices
- Few participants or capped position sizes
- Frequent halts or trading frictions
When participation is constrained, price can reflect constraints more than beliefs.
How Polls Work
Polls are small, noisy measurements trying to approximate a moving electorate. In Michigan primaries, the hardest part is not “asking questions.” It’s modeling who actually shows up.
Sampling and weighting
Pollsters sample a slice of voters, then weight responses to resemble the electorate they expect. The goal is simple. Make the sample look like primary day.
Weighting usually targets factors like:
- Age bands and gender
- Race and ethnicity
- Education level
- Region and media market
- Party ID or past primary vote
Where it fails is where the real electorate diverges from the assumptions. If education or region correlates with response rates, weights can’t fully fix the missing people. You get a “balanced” sample that is still unrepresentative.
When weights get heavy, treat the poll like an opinion model, not a headcount.
Likely-voter screens
Primaries hinge on who bothers to vote, so pollsters filter for “likely voters.” Those screens can help. They can also bake in the wrong electorate.
- Past vote: Voted in prior primaries
- Interest: Says they follow politics
- Registration: Registered in relevant party
- Self-report: Claims high likelihood
- Intent: Names a preferred candidate
Primary pitfall: new coalitions show up when the race gets interesting. Past vote screens can erase them. Self-reports can overstate turnout from low-propensity groups.
If a screen feels “too strict,” it can be a turnout forecast pretending to be a poll.
Field dates matter
A poll is a snapshot of sentiment during its field dates, not on election day. In a fast Michigan primary, news hits, endorsements land, and ads saturate specific media markets quickly. The median voter can shift before the crosstabs even get published.
Early voting windows magnify this. If many ballots are already cast, late movement changes fewer outcomes than headlines suggest. Old polls can mislead in both directions, either missing a surge or overstating one that already got “banked.”
Always anchor a poll to what happened during the interviewing, not when you read it.
House effects and modes
Pollsters have consistent skews, and modes shape who responds. You can’t fully correct it, but you can adjust your read.
- Check the mode: IVR, online panel, or live caller.
- Identify the sample: registered voters, likely voters, or past-primary voters.
- Look up the pollster’s typical lean across similar races.
- Discount small leads inside typical polling noise, especially in primaries.
- Cross-check with other modes before you “believe” a shift.
Your job isn’t to find the perfect poll. It’s to avoid overreacting to a pollster’s personality. Pew’s overview of survey mode effects is a useful reference point.
Polling error sources
Poll error is not one thing. It’s several small failure modes stacking up.
- Nonresponse: Certain voters don’t pick up or click
- Turnout model miss: The wrong people are labeled “likely”
- Question order: Earlier prompts change later answers
- Undecided allocation: Late deciders break unevenly
- Regional undercoverage: Some areas get too few completes
In Michigan primaries, regional undercoverage can be brutal because media markets and local issues differ. A Detroit-heavy sample is not the same as a statewide electorate.
Treat a single poll as a clue. Treat clusters as signal.
Side-by-Side Comparison
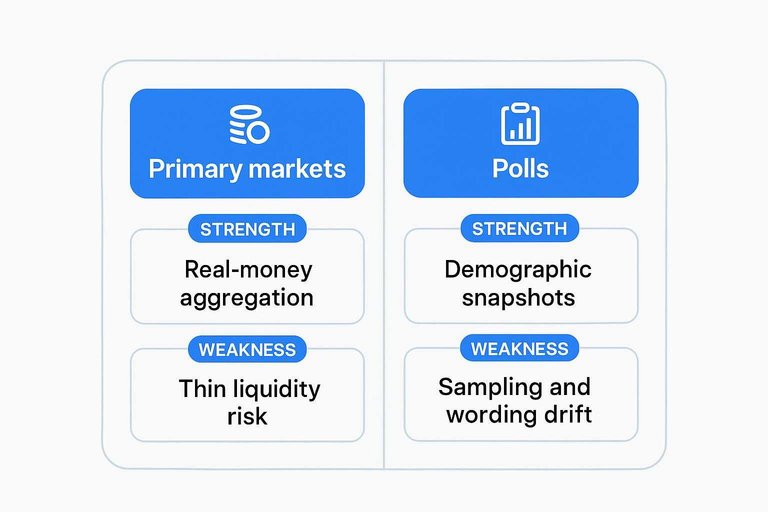
You’re choosing between two lenses on the same election: tradable probabilities versus sampled opinions. Put them next to each other so you know what to trust, when, and what to watch daily.
| Dimension | Primary markets | Polls | What to monitor daily |
|---|---|---|---|
| Strength | Real-money aggregation | Demographic snapshots | Market depth, new polls |
| Weakness | Thin liquidity risk | Sampling and wording drift | Spread changes, crosstabs |
| Best use-case | Timing and direction | Detecting coalition shifts | Volume spikes, subgroup moves |
| Failure mode | One-sided flow distortion | Late deciders miss | Order-book skew, likely-voter screen |
Treat disagreements as a signal, not a tie-breaker, then hunt the cause before you trade.
When Markets Beat Polls
Markets can move before polls because they reprice instantly on new information. In Michigan primaries, that speed matters most when the story shifts faster than survey cycles.
Imagine a late-breaking endorsement or court ruling hits midday. The market adjusts in minutes, and polls won’t reflect it until days later.
Fast-moving events
Prediction markets reprice on attention and expectations, not completed interviews. That makes them react within minutes to debates, endorsements, and legal news.
A clean debate hit can tighten spreads quickly. A damaging clip can do the same.
Trade the repricing window, not the eventual poll print.
Sparse or low-quality polling
Polls stop being tradable when coverage is thin or inconsistent. You need signals you can compare, not one-offs you can rationalize.
- Few active pollsters in-state
- Small or unclear sample sizes
- Inconsistent likely-voter screens
- Long gaps between releases
- House effects without context
When two polls can’t agree on the electorate, the market often becomes your cleaner aggregator.
Non-poll inputs
Markets absorb inputs that never show up as “vote intention” until late. Traders watch field operations, fundraising cadence, elite signaling, and local media narratives.
A campaign that quietly locks down endorsements and volunteer capacity can look “obvious” to insiders first. Surveys may miss it until turnout modeling catches up.
If the ground game is real, price can lead sentiment.
Tradable setups
Event-driven trades work when you define the scenario before the headline hits. You’re not predicting everything, just managing one catalyst.
- Write a thesis in one sentence, including what would falsify it.
- Name the catalyst and the exact time window you care about.
- Choose an entry trigger, not a vibe, and size for volatility.
- Add a hedge leg or a stop rule before you click buy.
- Set exit conditions for win, loss, and “nothing happened.”
If you can’t state your exit first, you’re not trading an event. You’re collecting emotions.
When Polls Beat Markets
Polls can outguide markets when prices stop reflecting broad belief and start reflecting who showed up to trade. That usually happens when liquidity is thin, narratives whip around, or voter preferences barely move.
Thin market conditions
Low-liquidity markets can print confident-looking prices from very few trades. In that environment, a careful poll with a clear sample and method often carries more signal than the last small order.
Imagine a contract where the best bid and ask are far apart, and size is tiny. One motivated trader can push the midpoint, and the chart looks like “new information.” It is not. It is microstructure noise.
When the tape is thin, treat price like a mood ring and use polls for direction.
Narrative overreaction
Hype cycles can move prices faster than voter beliefs change. You need quick tells that a storyline is driving the chart.
- One-day spike with no new polling
- Social chatter leads price, not data
- Price moves on clips, not releases
- Multiple independent polls disagree with price
- Reversal happens on low volume
If three signs show up together, you are trading a narrative, not an electorate.
Stable electorate periods
Some stretches are boring in the best way. Voter preferences are steady, and pollsters field frequently enough to keep your estimate fresh.
In those periods, a simple poll average can beat market sentiment because it updates smoothly. Markets still react to headlines, pundit frames, and order flow. Your edge is refusing to chase that noise.
When preferences are stable, consistency wins and overtrading loses.
Polling-based trade plan
A polling-first plan keeps you anchored to measurable changes. You are trading shifts in estimates, not vibes.
- Build a poll average using transparent inclusion rules.
- Weight polls by recency, heavier for newer field dates.
- Set trade thresholds, like “act only on clear moves.”
- Size positions smaller when polls are sparse or conflicting.
- Exit or reduce when new polls break your thesis.
Your job is to update fast and trade slow.
Execution and Risk Management for Michigan Primary Trades
Markets and polls can point you toward a view, but execution determines whether that view turns into a good trade. Michigan primary contracts often reprice around discrete catalysts (debates, endorsements, court rulings, ballot/filing news, and late-breaking reporting), which makes liquidity and slippage just as important as “being right.” Use the checklist below to translate a thesis into a repeatable trade plan.
Practical execution checklist
- Define your edge in one sentence. Example: “The market is underpricing Candidate A’s path because X is more likely than implied.” If you can’t say it simply, you’re likely trading noise.
- Set an entry range, not a single price. Decide the worst price you’re willing to take before you click.
- Decide your exit before you enter. Are you holding to resolution, or trading repricing? If it’s a trade, identify what changes your mind.
- Plan for the catalyst. If your edge depends on a scheduled event, assume spreads widen and fills worsen near the timestamp.
Liquidity, spreads, and market depth
Two markets can show the same implied probability and still be very different trades.
- Liquidity determines how expensive it is to be wrong on timing. In thin markets, a correct thesis can still lose money if you can’t enter/exit near fair value.
- Watch the spread and the visible depth. A tight spread with real size behind it is generally more tradeable than a “pretty” last price with no depth.
- Don’t confuse volume with fillability. Past activity doesn’t guarantee there’s resting liquidity at your price right now; check the order book (or the platform’s equivalent) before placing size.
Slippage control: limit orders and staged entries
If you care about execution quality, treat market orders as a last resort.
- Use limit orders for entries and exits. Decide your price, post the order, and let the market come to you.
- Split orders into tranches. Instead of buying your full position at once, layer bids/asks at multiple prices. This reduces the chance you move the market against yourself.
- Avoid chasing prints. If the price jumps on a headline, your edge may already be gone. Let the market stabilize, then reassess.
- Assume slippage increases when you need liquidity most. Around fast-moving news, spreads can widen and depth can disappear.
Position sizing and downside limits
Political contracts can feel “bounded” because they settle at 0/1, but your path-dependent risk is real.
- Size from loss limits, not conviction. Decide the maximum loss you’ll tolerate on the position (or idea) and back into position size.
- Keep correlated positions in one risk bucket. Multiple Michigan primary contracts can be effectively the same bet (e.g., winner + margin + party control proxies). Count them together.
- Plan for adverse selection. When you get filled quickly in a thin market, it may be because someone knows something you don’t. If that possibility would materially hurt you, reduce size or demand a better price.
Cross-platform price-shopping (and why it matters)
Even when two platforms list “the same” Michigan primary question, execution can differ due to fees, spreads, and available depth.
- Compare the best available price and the size available at that price. A slightly better headline price can be worse if there’s no depth.
- Account for fees in your true price. Your break-even is the all-in cost to enter and exit, not the displayed probability.
- Prefer the platform where you can both enter and exit. Getting the best entry is only half the trade; ensure there’s a realistic path to unwind without paying a large spread.
- Have a fallback venue. If liquidity vanishes where you intended to trade, you should already know your second-best option (or be willing to skip the trade).
A simple “trade card” to use before placing an order
Write this down (briefly) for every trade:
- Market: (contract and platform)
- Thesis: (one sentence)
- Entry: (limit price range, order type)
- Size: (and what makes you cut it)
- Exit: (target price and invalidation)
- Catalysts: (what you’re waiting for / what could hurt you)
If you can’t fill in the card without guessing, you’re not ready to risk capital—regardless of whether markets or polls are “right.”
Common execution mistakes in Michigan primary markets
- Trading right before a scheduled catalyst without adjusting for wider spreads.
- Using market orders in thin books and then blaming “the market” for slippage.
- Sizing based on confidence rather than a predefined loss limit.
- Treating multiple related contracts as independent bets.
- Entering because a price moved, without identifying what new information actually changed the fair value.
When to stand down
Skip the trade (or cut size) when:
- The spread is wide and there isn’t enough displayed depth to support your intended position.
- You can’t articulate what would make you exit besides “I’ll see how it goes.”
- The contract wording is ambiguous enough that settlement risk could dominate your edge.
- The only way your trade works is if you can exit instantly during a news spike.
Pick Your Primary Signal, Then Sanity-Check It
- Start with constraints: define your holding period, max drawdown, and whether you can tolerate overnight headline risk.
- If you need speed, look to markets—but only after checking liquidity, spreads, recent price jumps, and whether one venue is driving the move.
- If you need measurement, lean on polls—prioritize recent field dates, transparent likely-voter methods, and consistency across pollsters/modes.
- Combine when possible: use polls to anchor a baseline probability and markets to time entries/exits around new information, while treating big divergences as a cue to investigate turnout assumptions and late-break risk.
Frequently Asked Questions
- Are Michigan primary prediction markets more accurate than Michigan primary polls?
- Not consistently. Markets can absorb news and non-poll signals quickly, while high-quality polls can outperform when markets are thin, hype-driven, or slow to incorporate updated voter screens.
- What should I watch on Michigan primary election day to interpret market moves?
- Track turnout/line reports, major endorsements or candidate exits, official updates from state and county election offices, and reputable network calls—then compare those developments to whether market prices are moving on confirmed information or rumors.
- How do I sanity-check a Michigan primary market price against the polling data?
- Compare the market-implied probability to a polling average, then review the recency and pollster quality (method, sample, likely-voter screen) and look for a clear news catalyst that explains any gap.
- Can I use Michigan primary markets to trade down-ballot or delegate outcomes instead of just the winner?
- Often yes, when those contracts exist and have enough liquidity to trade. Just verify the contract’s exact settlement rules (e.g., vote share vs delegates) before using it as a signal.
- How often do Michigan primary polls change in the final week, and should I update my view daily?
- Late movement is common in primaries because turnout and late deciders can shift quickly. Update your read whenever a new high-quality poll drops or a major event changes the race, rather than reacting to every small price tick.