
 Best Platforms
 Live Odds








oddpool vs MarketsPrediction for prediction market data
A practical comparison of oddpool vs MarketsPrediction for prediction-market data—evaluate cross-platform live odds aggregation, trending discovery and volume-led scanning, platform comparison tables (deposits/payouts), and API/streaming depth so you can pick the right workflow for trading or building.
If you follow prediction markets across more than one venue, the hard part isn’t finding a market—it’s finding the right market at the right price, with enough volume to matter, before it moves.
This comparison breaks down oddpool and MarketsPrediction by what actually changes your day-to-day: where their data comes from, how quickly you can discover trending opportunities, how cleanly you can compare platforms (deposits, minimums, payout speed), and what you get when you need charts, alerts, APIs, and streaming.
Decision Snapshot
MarketsPrediction is the better default if your job is finding the best price fast across platforms. It’s built for discovery: live cross-platform odds aggregation, trending markets, and comparison tables that help you decide where to trade.
oddpool is a data platform for traders and builders who want normalized Kalshi + Polymarket data in one place. It’s strongest when you’re building tooling or running a data-driven workflow with WebSockets, APIs, whale tracking ($500+), and arbitrage/spread endpoints—within its plan limits and terms.
What each tool is
MarketsPrediction is a discovery and comparison layer across multiple prediction platforms. You use it to scan what’s moving, compare odds and activity, and pick where to place the trade.
oddpool is “Prediction Market Data for Traders and Builders” focused on Kalshi + Polymarket. It adds normalized feeds, dashboards, and APIs like WebSocket orderbooks/trades/distributions and endpoints such as /arbitrage/current and /arbitrage/current/difference.
Core use cases
Pick the tool based on whether you’re shopping markets or instrumenting them.
- Scan trending events across platforms
- Price-shop the same market across venues
- Filter by category and platform
- Build bots and dashboards on normalized data
- Stream orderbooks and trades via WebSockets
If you’re clicking into trades, MarketsPrediction leads. If you’re coding pipelines, oddpool shows up.
How we’ll judge
“Better” changes depending on whether you need discovery speed or data depth.
- Coverage across platforms
- Speed to opportunity
- Filtering and findability
- Transparency of market comparisons
- APIs and streaming access
- Costs and free access
- Constraints and terms
Decide your primary constraint first. Then the winner gets obvious.
Quick winners map
MarketsPrediction wins on cross-platform coverage, fast scanning, and side-by-side platform comparisons. Its trending feed and filters are designed for quick, repeated decisions.
oddpool wins on Kalshi + Polymarket data depth and builder features like WebSocket feeds, whale tracking ($500+), and arbitrage/spread APIs. Its real constraints matter, though: the free REST tier is capped at 1,000 requests/month and 1 req/sec, the free WebSocket tier is limited to 1 connection and 2 events, Premium is USD 100/mo for arbitrage API access, and its terms restrict resale/redistribution and competing data products.
If you want one recommendation: choose MarketsPrediction for market discovery and price shopping. Choose oddpool if you’re a trader-developer building on Kalshi + Polymarket data under those limits.
Coverage and Sources
You care about two things here: venue breadth and data depth. One helps you spot opportunity fast, the other helps you build and backtest.
| Dimension | MarketsPrediction | oddpool |
|---|---|---|
| Venue breadth | Multi-platform aggregator | Kalshi + Polymarket |
| Cross-venue search | Yes | Yes |
| Live odds view | Aggregated across venues | Normalized cross-venue |
| Streaming data | Not the focus | WebSocket: orderbooks, trades |
| Extra sources | — | Binance reference enrichment |
oddpool shines if you need a single normalized feed for Kalshi + Polymarket, especially over WebSockets. The catch is scope and constraints: free REST is 1,000 requests/month at 1 req/sec, and terms restrict resale or redistribution of its data (plus arbitrage API requires the Premium plan at USD 100/mo).
If you’re building bots or research pipelines, pick oddpool for deep, normalized Kalshi/Polymarket data; pick MarketsPrediction when scanning across more venues matters most.
Market Discovery Flow
Trending discovery
When you start with a vague idea, you need a fast way to see what’s actually live and moving. A trending markets feed does that by surfacing active events before you hunt.
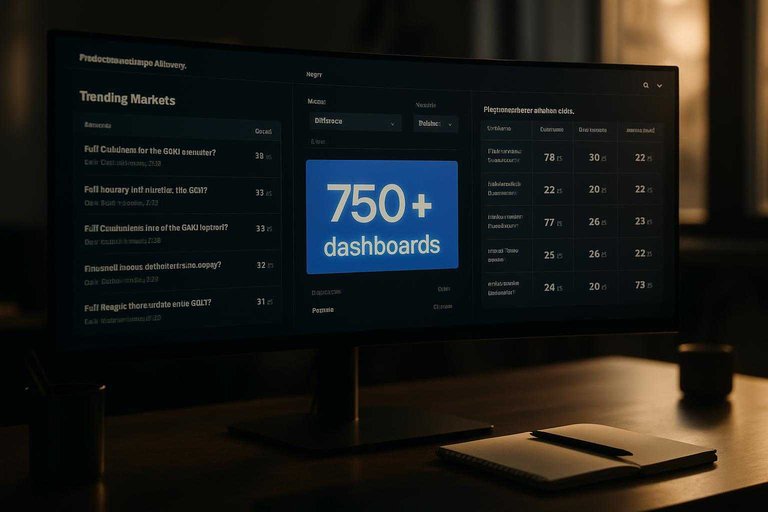
MarketsPrediction’s trending view is built for that first click: you scan what’s hot, then drill in. oddpool doesn’t lead with a “what’s trending” discovery layer; it leans on cross-venue search plus its 750+ event dashboards to get you to a specific event faster.
If you browse first and decide later, trending is the shortest path to a tradable market. (MarketsPrediction’s trending markets feed shows how this discovery-first workflow is designed.)
Filters that matter
Discovery speed comes down to a few filters you’ll use every single session. Get these right, and you stop wasting clicks.
- Category filter to stay in your lane
- Platform filter to match your account
- Sort by volume or activity
- Sort by price or spread
- Search within results
For narrowing choices quickly, category-plus-platform filtering tends to cut the list fastest.
Cross-platform price check
Once you’ve found the event, you still need the best line. The key difference is whether the tool aggregates live odds for you, or makes you search each venue.
Live cross-platform odds aggregation is a scan-first workflow: see prices side-by-side, then click through. oddpool is strong at cross-venue search across Kalshi + Polymarket, and it can normalize data via WebSocket feeds, but you’re often approaching price checks through an event dashboard or query rather than a pure comparison-first surface.
If your habit is “compare, then commit,” aggregation puts less friction between you and the trade.
Volume-led prioritization
Volume and attention signals keep you from overthinking dead markets. A “top markets by volume/views” list lets you pick battles where liquidity is more likely.
MarketsPrediction makes that prioritization easy with lists like top markets by volume and Top 30 views. oddpool shines differently: it offers a dedicated volume dashboard on paid plans, plus tools like whale trade tracking for trades sized $500+ that can highlight where serious money is leaning.
Use volume lists to choose what to watch, then use whale and spread tooling to decide what to build a position around.
Platform Comparison Tables
Deposits and payouts
Platform comparison tables are for operational decisions, not market takes. They let you compare deposit methods, minimum deposit, and payout speed without opening ten tabs.
MarketsPrediction leans into those side-by-side facts, so you can rule venues in or out fast.
Oddpool’s emphasis is different. It’s built around cross-venue search, historical charts, and APIs for normalized Kalshi + Polymarket data, including WebSocket feeds and whale tracking.
One real constraint: the free REST API is capped at 1,000 requests/month and 1 request/second.
If funding friction will block you from trading, tables beat “better charts” every time.
Venue selection checklist
Use tables to eliminate bad fits before you compare odds. Start with your constraints, then work inward.
- List constraints: jurisdiction, KYC tolerance, and account requirements.
- Check deposit methods you can actually use today.
- Compare minimum deposit against your intended position sizing.
- Prioritize payout speed if you plan to recycle capital quickly.
- Only then check whether your target markets exist on that venue.
Do this once, and you stop “choosing platforms” every time a new market pops.
When tables beat charts
Charts help you understand how a market moved. They don’t tell you whether you can fund, trade, and withdraw cleanly.
Structured facts are binary in a way price history isn’t. If a venue can’t take your deposit method, the best mispricing is irrelevant.
Oddpool is stronger when you’re analyzing the tape across Kalshi + Polymarket via normalized data feeds and endpoints. It’s less about operational venue fit, and more about what the market did and where.
Treat platform facts like plumbing. You only notice them when they fail.
Trading and Analytics
Discovery is where most traders start: you want cross-platform live odds, a trending feed, tight filters, and quick platform comparison tables. Trading support is what comes next, and that’s where oddpool leans in with tools meant for testing and execution feedback loops.
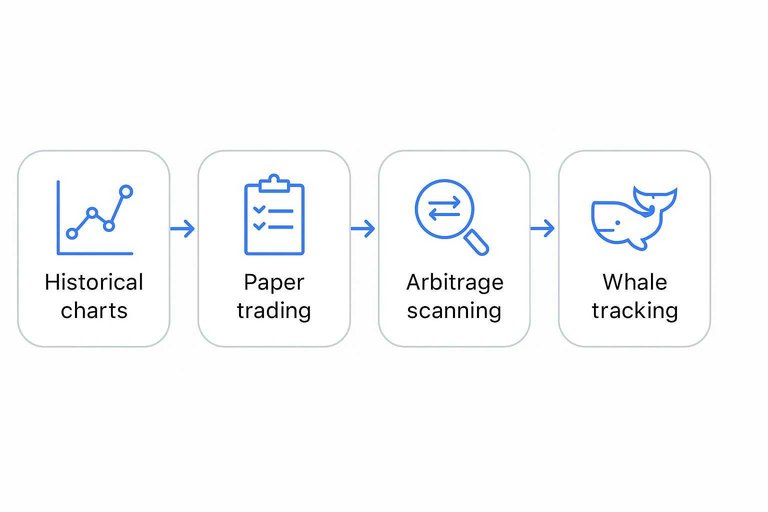
Historical charts
Oddpool pairs historical charts with 750+ event dashboards, so you can study how odds moved before you act. It’s a more “open a market and work it” workflow than a discovery-first surface that prioritizes cross-platform scanning, trending lists, and fast filtering.
Oddpool’s edge here is continuity: open an event, review past moves, then keep monitoring without changing tools. Its limit is venue coverage depth, since its normalized view is built around Kalshi + Polymarket rather than a broad multi-platform directory.
If your edge comes from timing and context, charts beat lists.
Paper trading
Paper trading is where strategy becomes testable, without forcing you to risk real money. Oddpool includes paper trading even on the USD 0/mo free tier.
That’s a concrete advantage for signal development, because you can rehearse entries, exits, and sizing against the same event dashboards you’ll later trade. The trade-off is you’re still operating inside oddpool’s supported venue universe, and the free API tier is capped at 1,000 requests/month and 1 request/second.
If you can’t test it safely, you don’t really have a strategy.
Arbitrage scanning
Oddpool’s paid plans add explicit “where’s the disagreement?” tooling for active traders. These are the features that turn cross-venue data into immediate to-do items.
Whale tracking
Whale tracking is a shortcut to “who just pushed the tape,” especially in thin markets. Oddpool includes whale trade tracking for trades sized $500+ on paid plans.
It’s most useful for active traders who watch order flow, builders who want alerts, and analysts who annotate moves after the fact. A real limitation is data reuse: Oddpool’s Terms prohibit resale, sublicensing, redistribution, or using its data in a competing product or commercial API.
If you trade momentum or mean reversion, whales are the footprints worth logging.
APIs and Streaming
REST tiers
Oddpool’s REST limits are clear, and they shape how quickly you can prototype versus scale. If you’re building anything that polls frequently, the tier boundaries matter.
Free is 1 req/sec and 1,000 requests/month, with 1 API key. Pro is 10 req/sec and 1M requests/month, with unlimited API keys. Premium is 25 req/sec and 5M requests/month, with unlimited API keys.
The constraint isn’t “rate limits.” It’s whether your product can survive on polling at all.
WebSocket normalization
Oddpool’s streaming pitch is developer-friendly: one connection, normalized schema, two venues. That reduces glue code, and it reduces failure modes.
You subscribe using event keys, not venue tickers, and get normalized feeds for Kalshi plus Polymarket. The WebSocket delivers orderbooks, trades, and probability distributions over that single connection.
If you’ve ever merged two market schemas at 2 a.m., this is the part you pay for.
Endpoints that matter
Builder usefulness comes down to a few endpoints you can wire into alerts, dashboards, and backtests. Oddpool’s list is short, but pointed.
- GET /arbitrage/current
- GET /arbitrage/current/difference
- GET /whales/user/feed
If you need arbitrage programmatically, plan for Premium access before you design around it.
Data usage constraints
Oddpool’s Terms draw a hard line around redistribution and competition. You can use the data for personal or internal use, not as a data product.
They prohibit resale, sublicensing, or redistribution of Oddpool data. They also prohibit incorporating Oddpool data into a competing product, data feed, or commercial API.
So the real question is packaging: are you building an internal tool, or shipping a market-data surface like MarketsPrediction? (The specific limitations are outlined on the Oddpool pricing and plan terms.)
API data integrity and operational reality
If you’re deciding between a discovery site and a data/API product, the deciding factor is rarely “does it have an endpoint?” It’s whether you can operate it day to day without silently degrading your app.
Freshness and staleness detection
- Ask what “fresh” means in practice: is the payload stamped with a server-side update time, a venue timestamp, and/or a sequence number you can use to detect gaps.
- Design for staleness as a first-class state (e.g., show “last seen” per market, pause alerts when feeds go cold, and avoid backtests that unknowingly mix live and stale snapshots).
Normalization and identity mapping
- “Normalized schema” isn’t the full problem; identity is. You need stable IDs for events/markets/contracts, plus a clear mapping between venue tickers and the normalized object.
- Watch for edge cases: renamed markets, merged/invalidated events, contract resolution states, and markets that exist on one venue but not the other.
Pagination, change feeds, and backfill
- For REST, pagination mechanics determine whether you can reliably crawl without missing items: cursor vs offset, stable sort order, and whether new items can reshuffle pages.
- For streaming, you’ll still want a backfill strategy: when a WebSocket reconnects, you need a deterministic way to fetch the missing window (trades/orderbook deltas) and re-anchor to a clean snapshot.
Rate limits as architecture constraints
- Limits aren’t just about throughput; they dictate your whole data model. If you can’t poll frequently enough, you either cache aggressively, switch to streaming, or change the product (fewer markets, fewer alerts, lower granularity).
- Budget requests explicitly: per-user dashboards, background refresh jobs, and backtests can all compete for the same quota.
Failure modes you should plan for
- Partial outages: one venue stalls while the other continues. Your UI and analytics should be able to mark per-venue health, not just “API up/down.”
- Duplicate/out-of-order messages: expect replays after reconnects; use idempotent writes keyed by trade IDs or sequence numbers when available.
- Schema drift: treat fields as optional and version your internal adapters so an added/renamed field doesn’t break ingestion.
In other words: before you pick “discovery” versus “data/API,” decide whether you’re prepared to run a data pipeline. The more your product depends on correctness (alerts, automation, backtests), the more these operational details matter.
Pricing and Limits
You’re choosing between a discovery layer (MarketsPrediction) and a data/API product (oddpool). Pricing only matters when you map it to your usage limits.
| Tool | Entry price | Key included limits | Scaling ceiling |
|---|---|---|---|
| MarketsPrediction | Not published | Live odds aggregation; trending feed; filters; top-by-volume lists | Best for scanning across platforms |
| oddpool Free | USD 0/mo | 1 req/sec; 1,000/mo; 1 key; WS: 1 conn; 2 events | Free caps hit fast |
| oddpool Pro | USD 30/mo | 10 req/sec; 1M/mo; WS: 3 conns; 10 events | Solid dev baseline |
| oddpool Premium | USD 100/mo | 25 req/sec; 5M/mo; WS: 10 conns; unlimited events | Real throughput tier |
Budget winner: oddpool Free if you need API access, MarketsPrediction if you just need cross-platform market discovery.
Scaling winner: oddpool Premium for high-volume API and WebSocket usage, but MarketsPrediction stays the better “wide scan” layer when speed of comparison matters.
Pick the Tool That Matches Your Workflow
If your priority is fast discovery and price checking across multiple venues—using a trending feed, category/platform filters, top-by-volume lists, and side-by-side platform tables—MarketsPrediction is the more direct daily driver for scanning and comparing where to trade. Choose oddpool when you specifically want a normalized Kalshi + Polymarket data layer with builder-grade features like WebSocket feeds (orderbooks/trades/distributions), whale tracking ($500+), and dedicated arbitrage/spread endpoints—while accepting real constraints like the Free tier’s 1,000 requests/month and 1 req/sec limits, the Free WebSocket cap (1 connection, 2 events, dist-only, no snapshots), Premium-only arbitrage API access at USD 100/mo, and terms that restrict data redistribution into a competing feed. For most readers, start by mapping your “find markets” flow (discovery + comparison) versus your “instrument markets” flow (streaming + endpoints), then choose accordingly.
Frequently Asked Questions
- Is oddpool the same thing as MarketsPrediction, or do they solve different prediction market data problems?
- They overlap on market discovery and data access, but they’re optimized for different workflows—oddpool tends to emphasize trader-facing signals and decision support, while MarketsPrediction is often positioned more as a builder-friendly data layer depending on the API features you need.
- Do I need an API to use oddpool vs MarketsPrediction for prediction market data?
- No—if you’re mainly scanning markets and monitoring odds, the UI can be enough; you only need an API when you want to automate ingestion, backtests, alerts, or integrate prediction market data into your own app.
- How do I validate prediction market data quality when comparing oddpool vs MarketsPrediction?
- Cross-check a sample of markets against the original venue for price/odds, timestamps, volume/liquidity, and resolution status, then confirm how each tool handles normalization, duplicates, and market lifecycle changes.
- Can I combine oddpool and MarketsPrediction in one workflow instead of choosing one?
- Yes—many teams use one tool for fast discovery and trader-style monitoring and the other for normalized exports or API-driven pipelines, as long as you standardize identifiers and timestamps across sources.
- What should I look for if I’m using oddpool vs MarketsPrediction for backtesting prediction market strategies?
- Prioritize historical depth, consistent time series granularity, documented odds/price definitions, and clear handling of resolved/voided markets, then verify you can export or query data reproducibly (CSV or API).