
 Best Platforms
 Live Odds








What Are Live Prediction Market Odds and How Do They Work?
An explainer on live prediction market odds and how they’re formed—treat odds as probabilities, see how trades and order books/AMMs set prices, understand what “live” updates really mean, learn to read odds correctly, and know why markets can still be wrong.
If prediction market odds are “live,” why do they sometimes jump, lag, or look out of sync with the news you’re watching? And why can two markets about the same event show different prices at the same moment?
This explainer shows you how odds are just tradable probabilities, how buying and selling turns into a quoted price, and what “live” actually means under the hood (updates, latency, pauses). You’ll also get a clear way to read common odds formats and a grounded list of reasons markets can misprice reality.
Odds as probabilities
Live prediction market odds are the continuously updated prices of event-linked contracts. They encode a crowd’s implied probability, shaped by trading, liquidity, and constraints.
The key idea is simple. Price is the current clearing level where marginal buyers and sellers meet. If trading is thin, the “probability” can be jumpy.
That’s why odds are best read as a market signal, not a pure truth meter.
Contract basics
A binary contract is the basic building block. It pays $1 if the event happens, and $0 if it does not.
If the contract trades at $0.63, the market is implying about a 63% chance. In a frictionless world, that price is also the expected value: 0.63×$1 + 0.37×$0.
Once you add fees and spreads, “fair” value becomes a range, not a point.
Why odds move
Odds move because the best available price changes. That happens when new information hits, or when trading pressure leans one way.
At any moment, the best bid is the top buy order, and the best ask is the top sell order. A buy that lifts the ask moves the last price up, while a sell that hits the bid moves it down.
When liquidity is thin, even small orders can set the “probability.”
Odds vs forecasts
Market odds look like a forecast, but they are a traded price. That difference shows up fast when money and constraints enter.
- Forecasts reflect your belief, even if you cannot trade.
- Odds reflect the marginal trade at bid/ask.
- Odds include fees, spreads, and slippage.
- Odds can embed risk and inventory pressure.
- Odds can be distorted by limits and illiquidity.
Treat odds as “what traders can clear now,” not “what the smartest person thinks.”
Mental model preview
You need a way to picture price as probability without over-trusting it. The thermometer model works because it connects trades to movement.
Each trade nudges the reading up or down. Market depth is the thickness of the glass: deep books resist movement, shallow books jump.
If you can move it with one trade, you’re measuring liquidity more than likelihood.
From trades to odds
Order book mechanics
Live odds start as orders, not opinions. What you see is whatever the order book can clear right now.
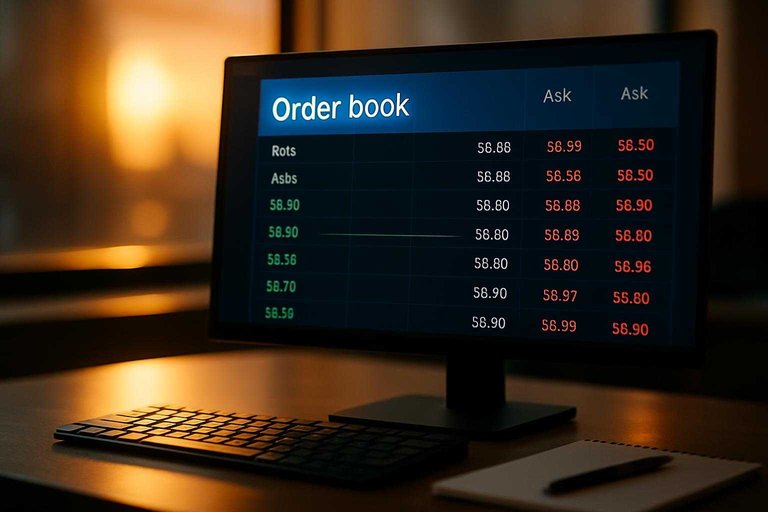
Bids are buy orders, stacked by price from highest down. Asks are sell orders, stacked from lowest up. The spread is the gap between the best bid and best ask. The last trade is simply the most recent match, which can be stale.
Platforms typically display odds as the midprice between best bid and ask, or as the best executable price for a small size. If you change size, the “real” odds can change too.
Displayed odds are a snapshot of available liquidity, not a statement of certainty.
Price impact
Market orders convert urgency into price movement. They do it by consuming liquidity level by level.
- You submit a market buy or sell for a given size.
- The order fills at the best available price first.
- If size remains, it fills the next price level, then the next.
- The average fill price becomes your effective odds.
- The best bid and ask update after consumed orders disappear.
If you “walk the book,” odds jump because depth was thin at the top.
Limit orders role
Limit orders are how you shape the odds without crossing the spread. They add structure to the book.
- Provide liquidity at a specific price
- Tighten spreads by competing at the top
- Anchor the midprice until taken
- Absorb market orders before bigger moves
- Disappear if canceled or expired
If you want stable odds, you need patient limit orders sitting there.
AMM pricing
Some prediction markets don’t match traders directly. They quote odds from a formula, then adjust after every trade.
In an AMM, price is the slope of a cost function: the next incremental share costs slightly more than the last. With constant-product intuition, you trade against a pool where moving one side up pushes the other down. With LMSR intuition, the market maker charges a growing premium as inventory becomes imbalanced.
Either way, your trade moves the state along a curve, and the displayed odds update instantly. Bigger trades move farther along that curve.
In AMMs, “depth” is math, not a stack of orders. For a broader foundation on crypto prediction market odds mechanics, see the full guide.
Arbitrage links
Odds stay coherent because traders punish inconsistencies. They buy the cheap side and sell the expensive side.
- Enforce yes/no parity within one market
- Align related outcomes across markets
- Move prices toward cross-venue consistency
- Close gaps created by slow updates
- Transfer information through capital flows
If odds look “wrong,” arbitrage is usually already on its way.
What “live” means
Live prediction market odds move as the order book and trades move. You are seeing a stream of quotes, last trade prices, depth shifts, and volatility changes as orders match or disappear. When you’re scanning across venues, that “live” feel can differ slightly by platform, which is why an aggregator view (like inabit’s MarketsPrediction) can be helpful for comparing where prices are actually moving versus where a UI is simply updating differently. For a practical workflow, see a 7-tool odds tracking setup.
Picture an election market right after a debate. Bids jump, offers get pulled, and the “odds” you see can change several times before you click—sometimes faster on one platform than another, even when they’re all reacting to the same headline.
Update sources
Live odds update because the market state changes. Those changes come from a few repeatable events.
- New limit orders added
- Market orders that fill
- Order cancellations or edits
- AMM swaps and rebalances
- Fee, oracle, or news shocks
If you can name the event, you can predict the next flicker on the screen—and if you’re watching multiple platforms at once, it also helps explain why the same contract can momentarily look “ahead” on one venue until others catch up.
Latency and batching
Odds can look “bursty” even when trading is continuous. That happens when platforms process and display updates in chunks.
Matching engines often run in short cycles, APIs may throttle update rates, and UIs may smooth rapid changes. You see the batch, not every micro-move.
This matters even more when you’re comparing markets across platforms: two venues can be equally active, but one may appear quieter simply because its public feed or interface batches updates differently. If it jumps, don’t assume manipulation; assume plumbing first.
Indicative vs executable
The odds you see are usually a best-available snapshot. The odds you get depend on how much you try to buy or sell.
Top-of-book quotes reflect the best bid and ask at small size. When your order is bigger than that, you “walk the book” into worse prices, which is slippage driven by depth.
Displayed odds are a headline; executable price is the receipt. When using a discovery/comparison view to spot “best prices,” it’s worth checking liquidity and depth alongside the headline odds—otherwise the apparent edge may vanish the moment you place meaningful size. (For a practical primer, Polymarket’s docs on walking the book explain how depth affects execution price.)
Halts and locks
Sometimes “live” stops being live. Platforms pause markets to protect settlement integrity or prevent chaotic pricing.
- Near resolution or settlement windows
- During disputes or invalidation reviews
- When liquidity dries up
- When price feeds pause
When odds freeze, your job is to wait or reduce reliance on that market. If you’re monitoring the same event across venues, a halt on one platform can also make cross-platform comparisons temporarily misleading—activity and price discovery may simply shift to the still-open markets.
Reading odds correctly
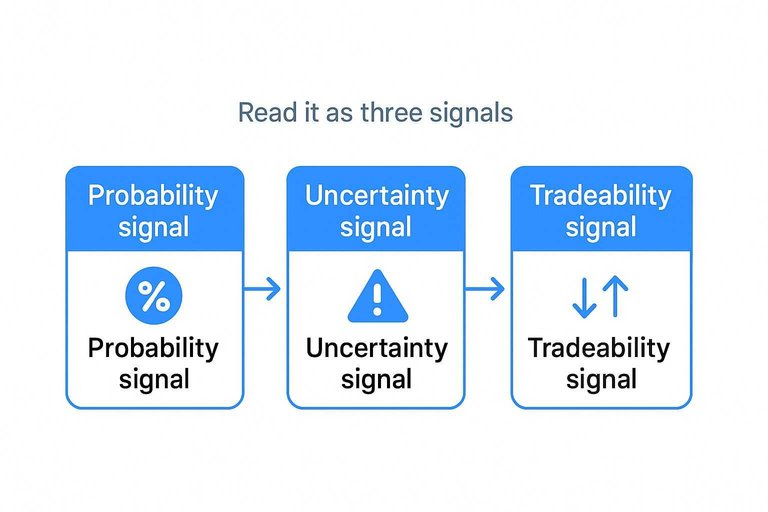
You’re staring at a live odds screen, and it’s easy to treat one number as “the truth.” It’s not. Read it as three signals at once: probability, uncertainty, and tradeability.
| What you see | Treat it as | Quick interpretation | What to do next |
|---|---|---|---|
| Price at 0.62 | Probability signal | ~62% implied chance | Compare to your estimate |
| Wide spread | Tradeability signal | Costly to enter or exit | Use limit orders, or wait |
| Fast price jumps | Uncertainty signal | New info is hitting | Check news, then re-evaluate |
| Huge volume, stable price | Tradeability signal | Easy fills, low slippage | Size up, but stay disciplined |
| Thin volume, big candles | Uncertainty + tradeability | Noisy and fragile market | Reduce size, demand a margin |
When you separate the “chance” from the “mess,” you stop arguing with the number and start exploiting the structure. For a deeper comparison of model-based probabilities versus what you can actually execute after spreads and fees, see predicted odds vs implied odds for trading.
Subsections: [
{
“subheading”: “A practical “edge” check (turning odds into a decision)”,
“content”: “Reading live prediction market odds correctly usually comes down to one question: is the difference between your probability and the market’s implied probability big enough to survive real-world trading frictions?\n\nUse a simple workflow:\n\n1. Start with the screen price (implied probability). Treat it as a headline, not your fill.\n2. Translate it into your likely execution. Look at the spread and depth. If you’d cross the spread or walk the book, your effective entry will be worse than the displayed odds.\n3. Mentally subtract the “all-in” costs. Fees, slippage, funding/transfer friction, and time-to-settlement all act like a tax on small edges.\n4. Add a settlement haircut when terms are messy. If resolution depends on an oracle call, a dispute window, or ambiguous wording, demand extra margin before trading.\n5. Size to liquidity, not conviction. If your size would move the price, you’re no longer “taking” odds—you’re partially setting them.\n\nThe takeaway: the cleanest interpretation of live prediction market odds is not “the chance is X,” but “I can buy or sell exposure near X under these constraints.” If you can’t trade at the number you’re reacting to, you’re analyzing a mirage.\n”
}
]
Why odds can be wrong
Live prediction market odds are a price, not a prophecy. Prices drift from “true probability” when trading is hard, incentives are skewed, or information arrives unevenly.
Liquidity constraints
Low liquidity makes odds jumpy because the book has little depth to absorb trades. One motivated order can push the price far, even without new information.
Imagine a market with only a few small resting orders near the midprice. A single buy can clear multiple price levels and print a much higher implied probability.
Thin books don’t reveal belief. They reveal who bothered to place orders.
Fees and spreads
Trading costs create a dead zone where nobody bothers to correct small mispricings.
- Maker/taker fees eat the edge on small corrections
- Wide bid-ask spreads hide the “real” midpoint
- Withdrawal fees discourage fast capital rotation
- Network fees add friction on-chain
- Slippage costs rise when size increases
If the mispricing can’t beat all-in costs, it persists by design.
Position limits
Even when someone knows the odds are off, they may not be able to size the trade. Rules and real-world constraints cap how much “truth” can be bought.
Limits can be explicit, like per-account position caps, or implicit, like KYC access and funding speed. Capital also has an opportunity cost, especially when settlement is far away.
Markets only converge as fast as the best-informed wallets can scale.
Manipulation dynamics
Manipulation depends on depth, incentives, and who is watching.
- A trader pushes the price with aggressive market orders.
- The move sticks if the book is thin and attention is low.
- Arbitrageurs step in when the price crosses their cost threshold.
- Depth refills as liquidity providers reprice and fade the move.
- The manipulator exits, paying spread, fees, and impact.
If arbitrage is awake and depth exists, manipulation becomes an expensive donation.
Settlement risk
Odds include a risk premium for getting paid late, or not getting paid cleanly. That premium grows when resolution is messy.
Ambiguous terms invite oracle disputes and subjective calls. Delays tie up capital, and dispute processes add uncertainty about timing and final outcomes.
When settlement is shaky, “fair probability” is the wrong benchmark. The right benchmark is probability minus hassle.
Use Live Odds Like a Pro (Without Overtrusting Them)
- Convert the quote to a probability first, then ask what new information would justify a move from that baseline.
- Check market quality: liquidity, spread/fees, and whether the displayed odds are indicative or actually executable right now.
- Sanity-test with mechanics: did a single trade move the price, is an AMM curve exaggerating impact, or is arbitrage likely to pull it back?
- Keep the failure modes in mind—limits, manipulation incentives, and settlement rules—so you treat live odds as a signal, not a guarantee.
Frequently Asked Questions
- Are live prediction market odds the same as sportsbook odds?
- No—live prediction market odds are market prices set by traders, while sportsbook odds are set by a bookmaker and typically include a built-in margin. Prediction markets can move differently because anyone can trade the price up or down as new information and liquidity arrive.
- Where can I compare live prediction market odds across platforms like Kalshi and Polymarket?
- Use a cross-platform odds aggregator to see the same event’s live prices, volume, and liquidity side by side without opening multiple apps. inabit does this by aggregating live odds across several prediction platforms so you can quickly spot where pricing and activity are best.
- What should I look at besides live prediction market odds before placing a trade?
- Check liquidity indicators like volume, spread, and order book depth (or AMM slippage) to understand how costly it will be to enter and exit. Also review market rules and resolution criteria so you’re trading the exact outcome you think you are.
- How do I measure whether live prediction market odds are becoming more accurate over time?
- Track forecast quality with proper scoring rules such as the Brier score or log loss by comparing the market probability at a fixed time (e.g., daily close) to the eventual outcome. For calibration, bucket probabilities (e.g., 10–20%, 20–30%) and check whether outcomes occur at roughly those rates over many markets.
- How often do live prediction market odds update, and why do they sometimes freeze or jump?
- They update whenever orders are placed, matched, or canceled, but they can appear to freeze when there’s little trading or when a platform throttles updates during heavy load. Sudden jumps usually happen when a large order crosses the spread, liquidity is thin, or new information triggers fast repricing.